What spreads and fees do to unusual options flow signals
By Faizan Ahmad. Updated .
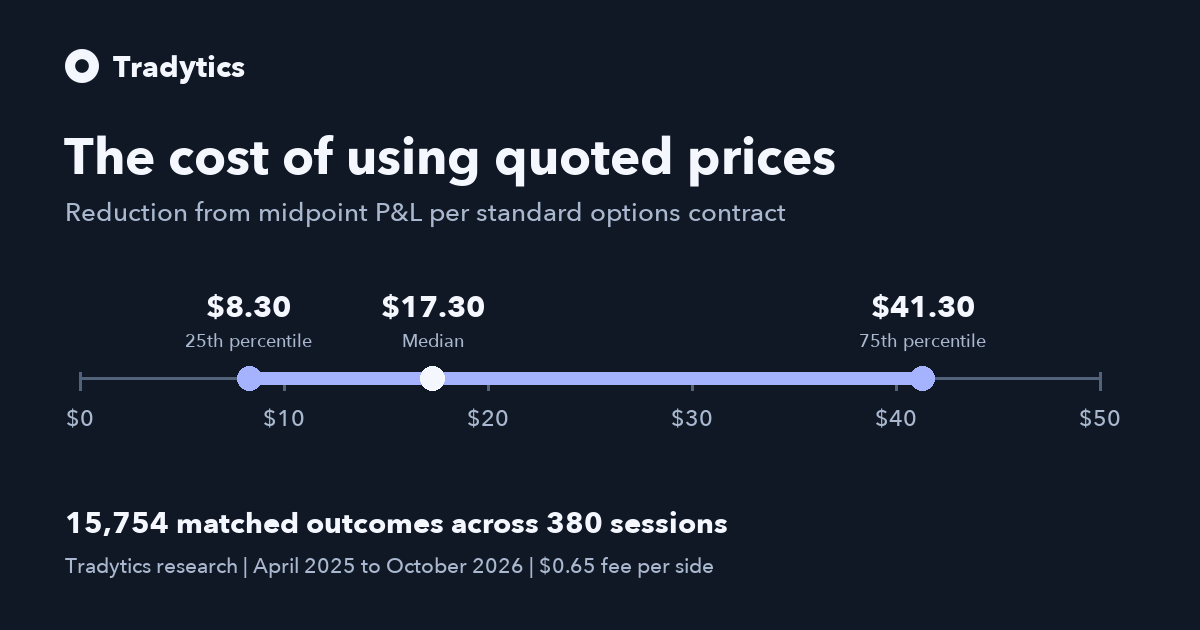
Bid-ask spreads and fees reduced the midpoint result by a median of $17.30 per contract in a Tradytics study of 15,754 priced unusual options flow outcomes across 380 US trading sessions. The middle half of the reductions ranged from $8.30 to $41.30. On 425 observations, a positive midpoint result became flat or negative after spreads and fees.
What changed when we used the bid and ask?
| Pricing method | Median P&L per contract | Positive outcomes |
|---|---|---|
| Midpoint at entry and exit | -$43.00 | 6,568 of 15,754 (41.7%) |
| Buy at ask, sell at bid | -$57.00 | 6,158 of 15,754 (39.1%) |
| Buy at ask, sell at bid, add fees | -$58.30 | 6,143 of 15,754 (39.0%) |
The $17.30 figure is the median of the differences for individual observations. The gap between the first and last medians in the table is $15.30. Those calculations answer different questions.
How Tradytics priced the same observations
We examined eight previously selected options-flow patterns across April 29, 2025 through October 30, 2026. Each observation pairs one detected event with a fixed exit horizon. Each contract was a standard US listed option with a 100-share multiplier. An event can have more than one exit horizon. We counted each event and horizon once across the eight patterns.
We took the first National Best Bid and Offer within 60 seconds of the entry target, which was two minutes after the flow print. We applied the same rule at the planned exit, before expiration. An invalid first quote made the outcome ineligible. Both pricing methods used the same contract, timestamps, and quotes. We required valid displayed sizes and an uncrossed book. The fee model used $0.65 on each side for one contract. The quotes model execution for that size and exclude additional slippage and market impact.
Midpoint P&L in dollars equals 100 times the exit midpoint minus the entry midpoint. The second method uses the exit bid minus the entry ask, times 100. The third subtracts $1.30 in total fees. We paired the results before calculating the cost distribution. A positive outcome means P&L greater than zero.
We priced 15,754 of 21,213 event and horizon pairs (74.3%). The largest exclusions were 2,693 without an exit quote, 2,157 without an entry quote, and 442 with exit windows beyond the end of the sample. The pattern selection used data from this period, so the results describe the selected historical sample. The paired pricing comparison shows the effect of the modeled costs on those priced outcomes.
Download the aggregate results or download the coverage counts. The quote specification defines the displayed bid, ask, sizes, and timestamps we used.
Inspect a flow order with the Tradytics API
Tradytics reads the US options tape and reconstructs orders from their fills. The options flow API returns the order type, side, contract and the quoted bid and ask. Watch the demo or download the Python example. Run it with Python 3 for a public illustrative sample. With a Pro API key, add a ticker and a session date to use the same code on historical orders.
python3 options-flow-example.py
python3 options-flow-example.py --symbol SPY --date 2026-10-30
The same dataset is available to AI workflows through the Tradytics MCP server. You can also inspect the orders in Tradytics Flow.
Common questions
Why do midpoint and bid-ask results differ?
The midpoint sits halfway between the best bid and ask. A marketable buy generally pays the ask and a marketable sell generally receives the bid. Each side can give up half a spread relative to the midpoint, plus any fee.
Why compare the same entry and exit quotes?
Pairing keeps the contract, event, and holding period fixed. The difference then measures what the two pricing methods and the fee assumption do to that observation.
- Most bullish options flow on 2026-11-11: INTC ($29.85M net), TSLA ($23.42M net), META ($14.92M net), SITM ($14.46M net), AAPL ($13.49M net).
- Most bearish options flow on 2026-11-11: AMD ($65.50M net), SNDK ($25.62M net), MSFT ($15.69M net), CRWV ($12.17M net), MRVL ($11.87M net).
Updated 2026-11-12 00:51 UTC