What is options flow?
By Faizan Ahmad. Updated .
Options flow is the live record of large options trades as they print on US exchanges: which contract traded, how many contracts, how much money changed hands, and whether the buyer or the seller was the one pushing. Traders watch it to see where big money is placing bets and hedges, by strike and by date. It shows what was traded, not why: the same print can be a bullish bet, insurance on a stock portfolio or one leg of a bigger trade.
What does options flow show?
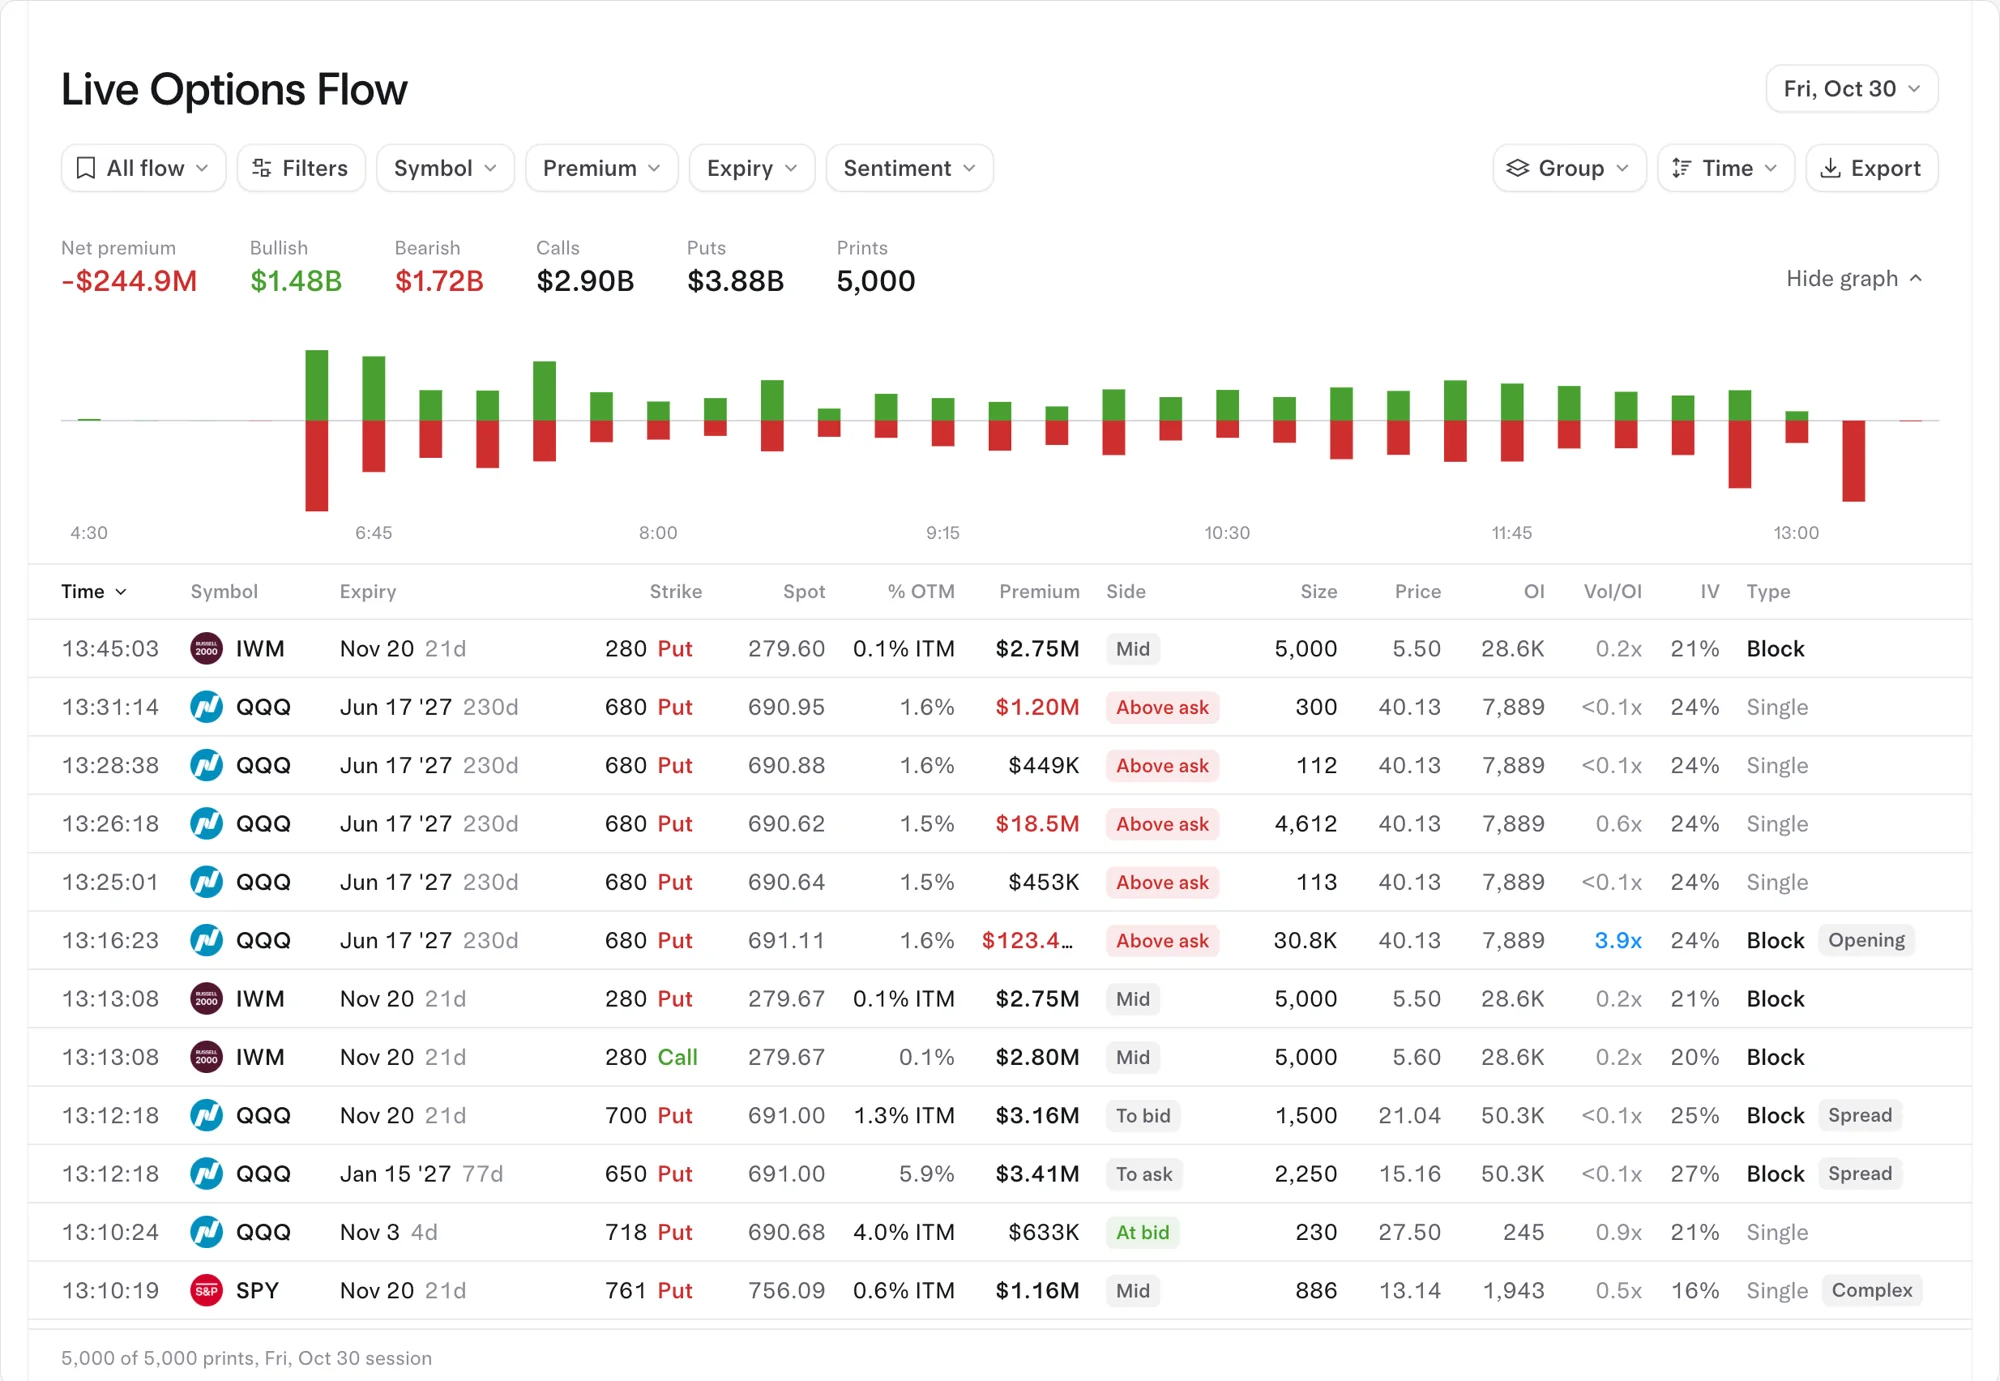
Each row is one trade, or "print." A good flow feed gives you everything you need to size it up in a few seconds:
| Column | What it tells you |
|---|---|
| Symbol, call or put | Which stock or ETF, and whether the contract gains on a rise (call) or a fall (put) |
| Expiry and days to expiry | How long the trade has to work |
| Strike, spot and % OTM or ITM | How far the stock has to move before the option is worth something at expiry |
| Premium | Total dollars paid: contracts × price × 100 |
| Side | Where the trade filled against the bid and ask, which shows who was likely aggressive |
| Size, open interest and Vol/OI | How many contracts traded versus how many already existed |
| Type and tags | Sweep, block, split or single, plus flags like Opening or Spread |
Where does options flow data come from?
Every US options exchange reports its trades and quotes to the Options Price Reporting Authority (OPRA), which publishes them as one consolidated feed. That covers every exchange family: Cboe, Nasdaq, NYSE, MIAX, BOX, MEMX and IEX. A flow tool reads that feed, keeps the large prints and adds what a raw tape doesn't give you: which side was likely aggressive, whether one order was swept across several exchanges, and whether the size beat open interest. The plumbing is covered in where options flow data comes from.
What did options flow look like on October 30, 2026?
On Friday, October 30, 2026, the S&P 500 fell 1.59% and the Nasdaq 100 dropped 3.16% as chip stocks sold off. The day's large prints added up to:
- 73,896 prints: $11.84B in calls and $12.72B in puts.
- A put/call ratio by premium of 1.07: 1.26 on index options and 0.91 on single stocks.
- Net premium of -$86.53M, a bearish lean.
Two lessons hide in those numbers. First, the lean is thin: -$86.53M is about 0.35% of the $24.56B traded, because most flow is two-sided. Second, puts outweigh calls on index options because that is where funds buy portfolio insurance, so a high index put/call ratio is normal, not a crash call (see what the put/call ratio tells you).
Single names told sharper stories. Citigroup (C) had the most bullish net premium in the market, $93.80M out of $215.39M in bullish and bearish premium, and MSTR had the most bearish, -$44.61M out of $160.66M. Both stocks fell that day, Citigroup by 2.6% and MSTR by 6.7%: flow describes positioning, not tomorrow's price.
Who is behind the flow?
Large prints mostly come from institutions: funds hedging portfolios, funds and traders expressing a view, and desks rolling or adjusting positions they already hold. Market makers take the other side of much of it and hedge themselves in the stock. Retail orders are rarely big enough to show up. That mix is why the same-looking row can mean very different things.
What can options flow tell you, and what can't it?
| It can tell you | It can't tell you |
|---|---|
| Where money went: strike, expiry, call or put | Why: a bet, a hedge, a spread leg or a roll |
| How much: the premium paid | The rest of the trader's position (stock, other legs, other brokers) |
| Who was likely aggressive, from the fill price | Who started the trade for certain: no public feed records it |
| Whether the size had to be new (bigger than open interest) | Whether a smaller trade opened or closed, until open interest updates |
| Which names drew unusual money | How the trade ends |
That is why experienced traders treat flow as context, not a signal. Whether trading off it pays is answered honestly in does following unusual options activity work?
Options flow vs unusual options activity
Options flow is all of the large trades. Unusual options activity is the slice that is big for that particular contract, usually a trade larger than the contract's open interest. Most traders scan the flow, then zoom in on the unusual prints.
How to see it on Tradytics
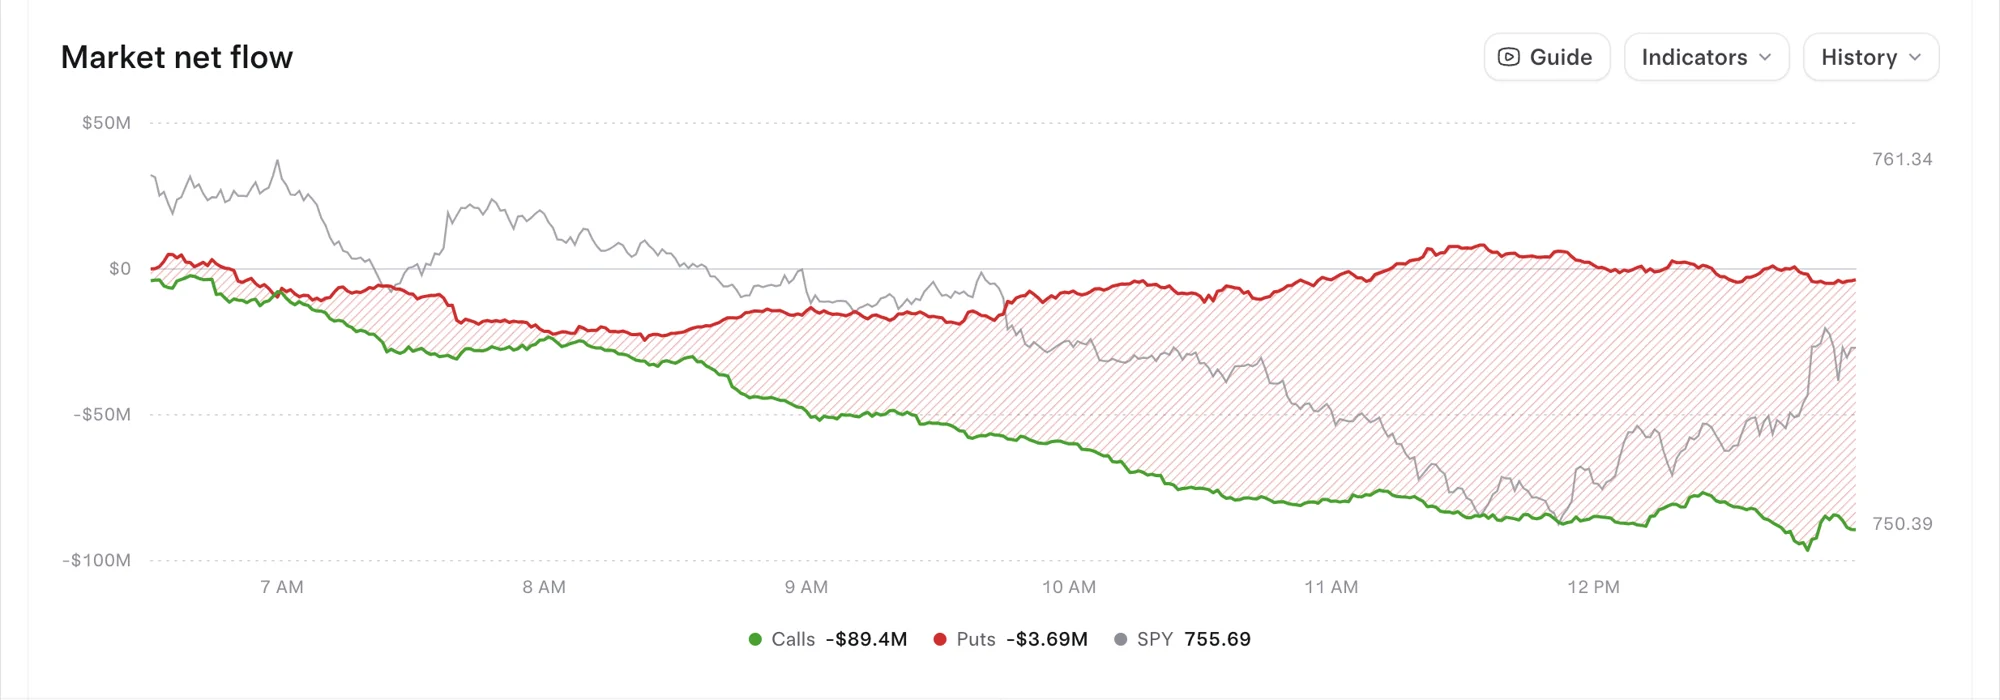
Open the Live options flow page: every large print from OPRA with its side chip (Above ask through Below bid), its type (Sweep, Block, Split, Single) and tags such as Opening and Spread. It is live to the second on the Live and Pro plans; the Free plan shows yesterday's session. For the market-wide picture, the options market page shows net flow through the day and a money map of where premium went, and how to read options flow, step by step walks through one real row.
Common questions
Is options flow real time?
Trades are reported to OPRA as they happen, and on Tradytics Live and Pro the flow page updates to the second. The Free plan shows the previous session.
Is options flow the same as dark pool data?
No. Options flow is options trades, which happen on exchanges. Dark pool prints are off-exchange stock trades, reported to FINRA after they execute. Traders often read the two together.
Does heavy call buying mean a stock will go up?
Not by itself. On October 30, 2026, Citigroup drew the most bullish net premium of any stock and still fell 2.6% that day. Calls can hedge a short stock position or be one leg of a spread, and real bets are often wrong.
Why does premium matter more than the number of contracts?
Premium is the money actually at risk. On October 30, 2026, 4,481 Meta $780 calls cost $6.60M, while just 170 AMD $910 puts cost $7.28M. More on that in why premium matters more than contracts.
Sources
- Options Price Reporting Authority (OPRA): disseminates consolidated last sale and quotation information from the SEC-approved options exchanges, and lists every participant exchange.
- FINRA: Options: what calls, puts and premium are, and the definition of open interest.
- Most bullish options flow on 2026-11-02: MRVL ($23.00M net), AMZN ($16.00M net), TSLA ($12.11M net), LITE ($6.09M net), PLTR ($4.27M net).
- Most bearish options flow on 2026-11-02: AAPL ($40.91M net), AMD ($20.61M net), MU ($10.73M net), ORCL ($8.12M net), NVDA ($7.88M net).
Updated 2026-11-02 16:03 UTC