What is the put/call ratio, and is a high one bullish or bearish?
By Faizan Ahmad. Updated .
The put/call ratio divides put activity by call activity, usually by contract volume (Cboe publishes daily total, index and equity ratios), sometimes by premium or open interest. Above 1 means more puts than calls. A high ratio looks bearish, but traders often read extremes as contrarian, because heavy put buying tends to peak when fear does, and the ratio can't tell bought puts from sold puts. On October 30, 2026, SPY's put/call ratio by premium was 2.26, yet its options flow leaned bullish by $55.55M.
How is the put/call ratio calculated?
Put activity divided by call activity. What counts as "activity" changes the number a lot:
| Version | Formula | SPY on October 30, 2026 | Best for |
|---|---|---|---|
| Volume | Put contracts traded ÷ call contracts traded | Not shown here | The standard; what Cboe publishes daily |
| Premium | Put dollars ÷ call dollars | 2.26 ($1.09B ÷ $481.77M) | Weighting by money, so cheap lottery contracts count less |
| Open interest | Open puts ÷ open calls | 2.96 (3,874,192 ÷ 1,309,658) | Standing positioning rather than one day's trading |
The Tradytics numbers on this page are by premium, from large prints. Cboe's daily statistics page splits volume ratios into total, index, equity, exchange-traded products and SPX. Always check which version you're looking at before comparing two readings.
Is a high put/call ratio bullish or bearish?
It depends on which of three readings you use.
- At face value, bearish. More puts than calls suggests traders are protecting against, or betting on, a drop.
- At extremes, contrarian. Many traders treat a very high ratio as a sign of fear that often shows up near short-term lows, and a very low ratio as complacency. The useful comparison is with the ratio's own recent history, not a fixed cutoff.
- By side, it depends who bought. A put sold is a bullish trade and a put bought is a bearish one, but both add to the ratio. That's the biggest blind spot.
Research backs the third reading. Pan and Poteshman (NBER, 2004) built put/call ratios only from volume that buyers initiated to open new positions. Stocks with low ratios beat stocks with high ratios by more than 40 basis points the next day and more than 1% over the next week, risk-adjusted. They traced the edge to traders with information the public didn't have. The point for everyone else: the information is in who opened what, which a raw total ratio throws away.
October 30, 2026 in numbers
| Market or ticker | Put/call by premium | Day's move |
|---|---|---|
| Whole market (large prints) | 1.07 (puts $12.72B, calls $11.84B) | S&P 500 -1.59% |
| Index options | 1.26 | Many names |
| Single stocks | 0.91 | Many names |
| SPY | 2.26 | -1.59% |
| QQQ | 2.17 | -3.16% |
| AMD | 1.56 | -10.28% |
| Microsoft (MSFT) | 0.51 | -1.35% |
| Meta (META) | 0.48 | -1.68% |
Two patterns show up. Index products run far higher ratios than single stocks (1.26 against 0.91 that day), because indexes are where portfolios buy protection. A 2.26 in SPY and a 2.26 in a single stock mean very different things. And the ratio didn't sort the day's losers: Meta and Microsoft had low ratios and still fell. AMD's 1.56 came on the day of a 10.28% drop, and a same-day ratio can't tell you whether the puts led the move or chased it.
The SPY paradox: a 2.26 ratio and a bullish lean
| SPY, October 30, 2026 | Premium |
|---|---|
| Puts bought | $354.12M |
| Puts sold | $384.30M |
| Calls bought | $144.57M |
| Calls sold | $119.20M |
| Bullish vs bearish premium | $528.87M vs $473.32M |
| Net | $55.55M bullish |
SPY traded more than twice as many put dollars as call dollars, which is where the 2.26 comes from. But more put premium was sold than bought, and more call premium was bought than sold. Selling puts and buying calls both lean bullish, so the flow tilted bullish on a day SPY fell 1.59%. The ratio counted the puts. Only the side of each trade said what they meant. How to tell if options were bought or sold and what is net options flow go deeper.
How traders use the put/call ratio well
- Compare it with itself. A reading against its own 10- or 20-day average says more than any absolute number.
- Keep index and equity ratios apart. Index ratios carry constant hedging demand.
- Check the side. Split puts and calls into bought and sold before drawing a conclusion.
- Read it with price. A spike in the ratio into a selloff is a different signal from a spike during a calm rally.
- Be careful on expiration days, when closing and rolling trades inflate volume. See what is OPEX.
How to see it on Tradytics
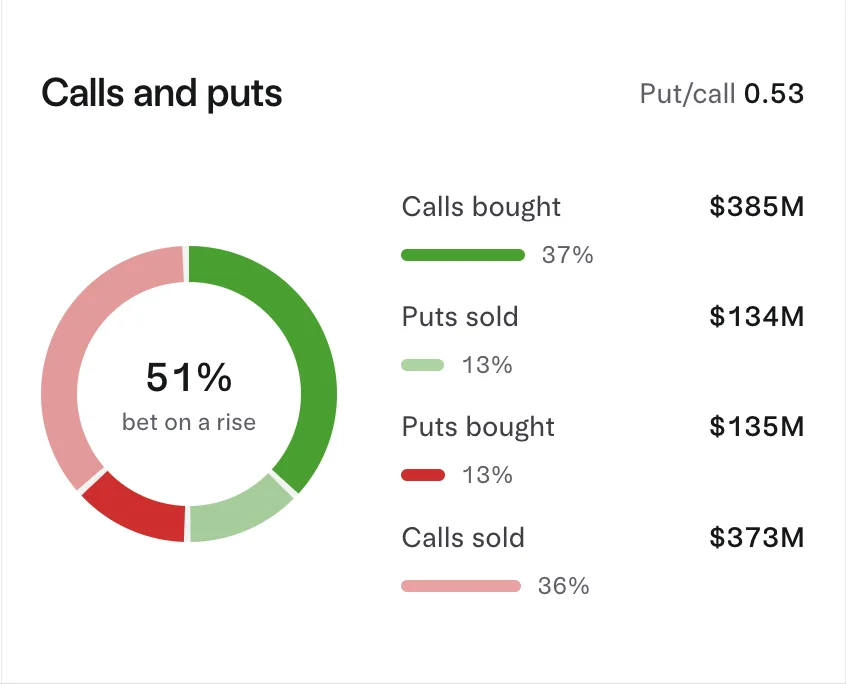
The options market page shows calls against puts premium through the day for the whole market. Each options research page, such as SPY options, has a Calls and puts card that splits the money into calls bought, calls sold, puts bought and puts sold, with the put/call ratio at the top, so you can see the side behind the ratio. Live and Pro update with the flow to the second; Free shows yesterday's session.
Common questions
What is a normal put/call ratio?
It depends on the version and the product. Single-stock ratios tend to run lower than index ratios, as on October 30, 2026 (0.91 against 1.26 by premium). Judge any reading against that series' own history.
Is a low put/call ratio bullish?
At face value, yes: more calls than puts. At extremes, contrarian traders read it as complacency. And as with high ratios, sold calls count the same as bought calls.
Volume or premium: which put/call ratio is better?
Volume is the standard and the one with the longest history. Premium weights by money, so a flood of cheap contracts doesn't swamp it. Use the same version consistently.
Where can I find the daily put/call ratio?
Cboe publishes its volume-based ratios every trading day on its market statistics page. On Tradytics, each ticker's options research page shows the premium-based ratio with the bought and sold split behind it.
Sources
- Cboe, U.S. Options Daily Market Statistics: daily total, index, equity, exchange-traded product and SPX put/call ratios by volume.
- Pan and Poteshman, The Information in Option Volume for Future Stock Prices (NBER Working Paper 10925, 2004): put/call ratios from buyer-initiated opening volume predict next-day and next-week returns.
- Options Industry Council, Open Interest: Why It Matters: open interest, the basis of the open interest version of the ratio.
- SPY options traded $335.90M in premium on 2026-11-02: $193.59M in calls and $142.32M in puts, a net bullish lean of $32.03M.
- Put/call ratio 0.74.
- Options price a move of about ±$6.07 by 2026-11-02.
- Max pain for 2026-11-02 is $765.0.
Updated 2026-11-02 16:05 UTC