What is net options flow (net premium)?
By Faizan Ahmad. Updated .
Net options flow, also called net premium, is the dollar value of options trades that lean bullish minus the trades that lean bearish over a period. Calls bought (filled at or toward the ask) and puts sold (at or toward the bid) count as bullish; puts bought and calls sold count as bearish; trades at the mid count for neither. On October 30, 2026, large prints across the US market netted -$86.53M, a bearish lean, out of $24.56B in premium traded. That is the thing to remember about net flow: it is usually a small difference between two very large numbers, so the net as a share of what traded matters as much as the dollar figure.
How is net premium calculated?
Every large print is sorted by what it was and which side of the market it hit. Premium is contracts times price times 100.
| Bought (to, at or above the ask) | Sold (to, at or below the bid) | |
|---|---|---|
| Calls | Bullish | Bearish |
| Puts | Bearish | Bullish |
Net premium is the bullish total minus the bearish total. Here is Nvidia on October 30, 2026:
| Nvidia (NVDA), October 30, 2026 | Premium | Counts as |
|---|---|---|
| Calls bought | $352.44M | Bullish |
| Puts sold | $123.90M | Bullish |
| Calls sold | $347.47M | Bearish |
| Puts bought | $109.25M | Bearish |
| Net premium | $19.61M | Slight bullish lean |
The bullish side came to $476.34M and the bearish side to $456.72M. Another $249M or so printed at the mid and counted for neither. So "NVDA net flow $19.61M bullish" is true, but it is 2.1% of the $933.06M that had a lean: close to a tie.
Why does the share matter more than the dollar figure?
Divide the net by the premium that had a lean and the picture changes. These were the most bullish and most bearish names by net premium on October 30, 2026:
| Stock | Net premium | Premium with a lean | Net as a share |
|---|---|---|---|
| Citigroup (C) | $93.80M | $215.39M | 43.5% |
| Alphabet (GOOGL) | $58.61M | $301.20M | 19.5% |
| Marvell (MRVL) | $31.01M | $151.62M | 20.5% |
| Meta (META) | $23.40M | $189.34M | 12.4% |
| Nvidia (NVDA) | $19.61M | $933.06M | 2.1% |
| Teradyne (TER) | $17.47M | $35.33M | 49.4% |
| Strategy (MSTR) | -$44.61M | $160.66M | -27.8% |
| Tesla (TSLA) | -$32.94M | $289.62M | -11.4% |
| AMD (AMD) | -$28.20M | $286.66M | -9.8% |
| TSMC (TSM) | -$26.42M | $70.09M | -37.7% |
| CrowdStrike (CRWD) | -$20.89M | $40.78M | -51.2% |
| Bloom Energy (BE) | -$15.40M | $49.85M | -30.9% |
Ranked by dollars, Nvidia is a top-five bullish name. Ranked by share, it is the most balanced stock on the list, while Teradyne's $17.47M and CrowdStrike's -$20.89M were close to half of everything that traded with a lean: genuinely one-sided days. A big stock can post a big net number on a near tie simply because so much trades in it.
None of this told you what the stocks would do that day. All twelve fell in a selloff led by tech and AI chips, the bullish names included; does following unusual options activity work? looks at that test in detail.
Why can net flow be bullish on a down day?
Because selling puts counts as bullish, whoever does it. On October 30, 2026, SPY fell 1.59%, yet its net premium was $55.55M bullish. Both halves leaned that way: calls bought beat calls sold by about $25M ($144.57M vs $119.20M), and puts sold beat puts bought by about $30M ($384.30M vs $354.12M). On a falling day, the bigger bullish piece was put selling.
Some of those put sales were traders betting the drop would stall, a real bullish view. Others were traders who had bought puts earlier and sold them at a profit as SPY fell, which is cashing in a hedge, not turning bullish. Both count the same in the formula, because the exchange tape doesn't say whether a trade opened or closed a position. Opening vs closing and how to tell if an option was bought or sold cover what you can and can't infer.
Net premium vs the put/call ratio
| Net premium | Put/call ratio | |
|---|---|---|
| What it measures | Bullish minus bearish dollars, using the side of each trade | Put volume or premium divided by call volume or premium |
| How it treats a put sale | Bullish | Adds to the put side, like any put |
| SPY on October 30, 2026 | $55.55M, a bullish lean | 2.26, very put-heavy |
| Best for | Which way aggressive money leaned | How much protection the market is buying or holding |
The two can point in opposite directions on the same day, as SPY's did. More on the ratio in what is the put/call ratio.
How do you use net flow without fooling yourself?
- Read it as a share. Net divided by the premium with a lean separates one-sided days from near ties.
- Compare a stock with itself. $20M of net premium is a lot for a small company and a rounding error for Nvidia.
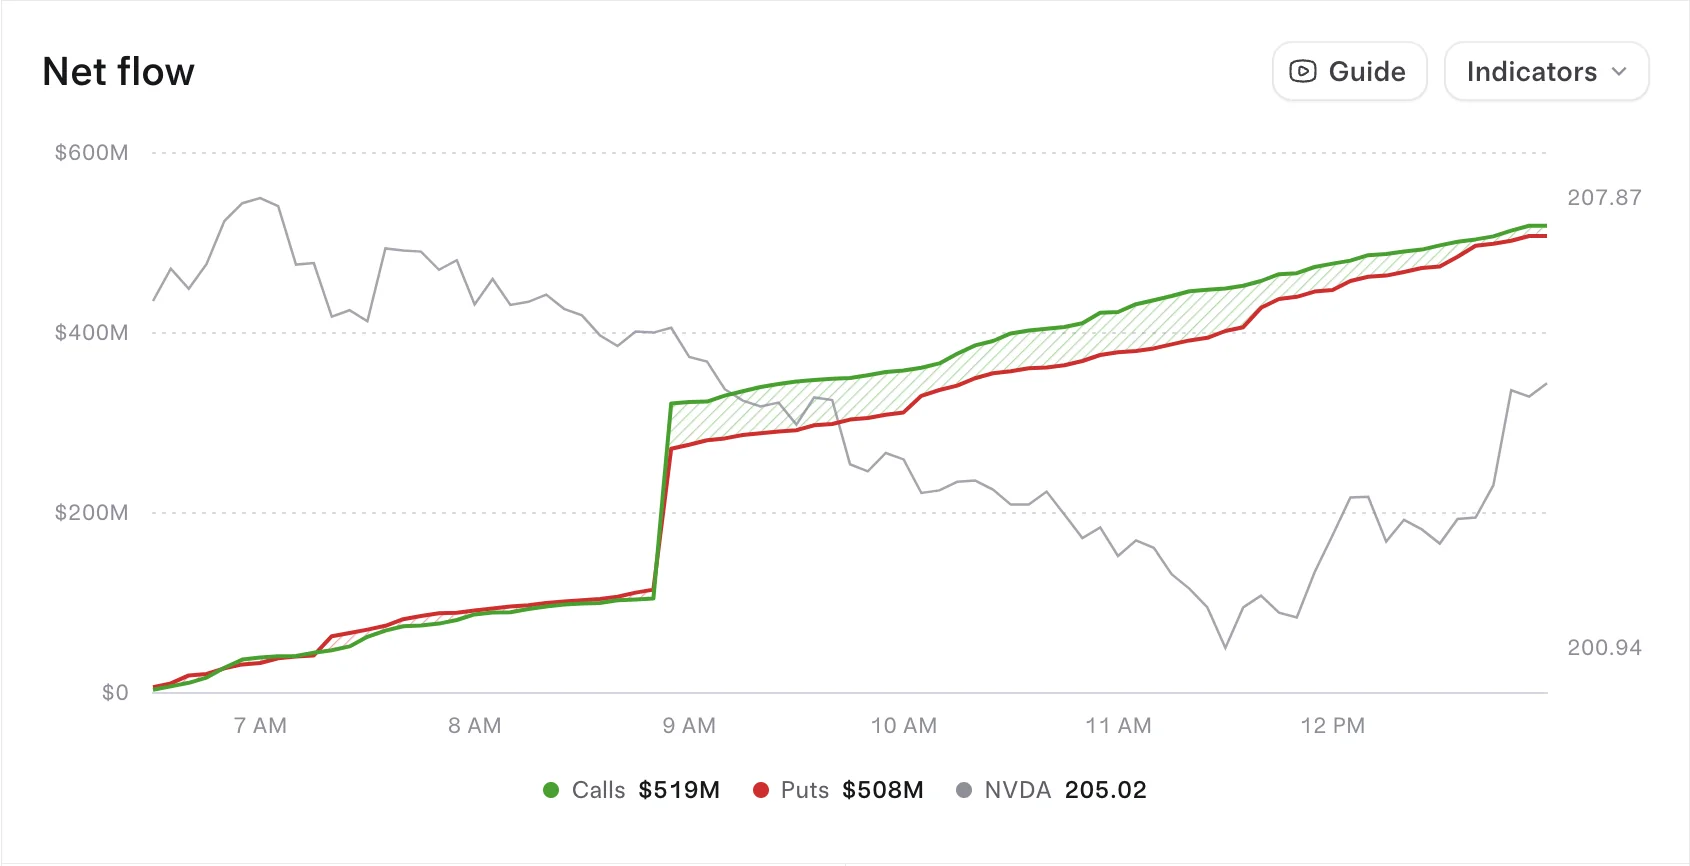
- Watch the line, not the final number. Flow that builds before the price moves is more interesting than flow that chases it.
- Find what drove it. One large print, or one leg of a spread, can swing a whole day. Open the largest orders and see how to read spreads.
- Don't trade it alone. It describes how traders positioned, not what the stock will do next.
How to see it on Tradytics
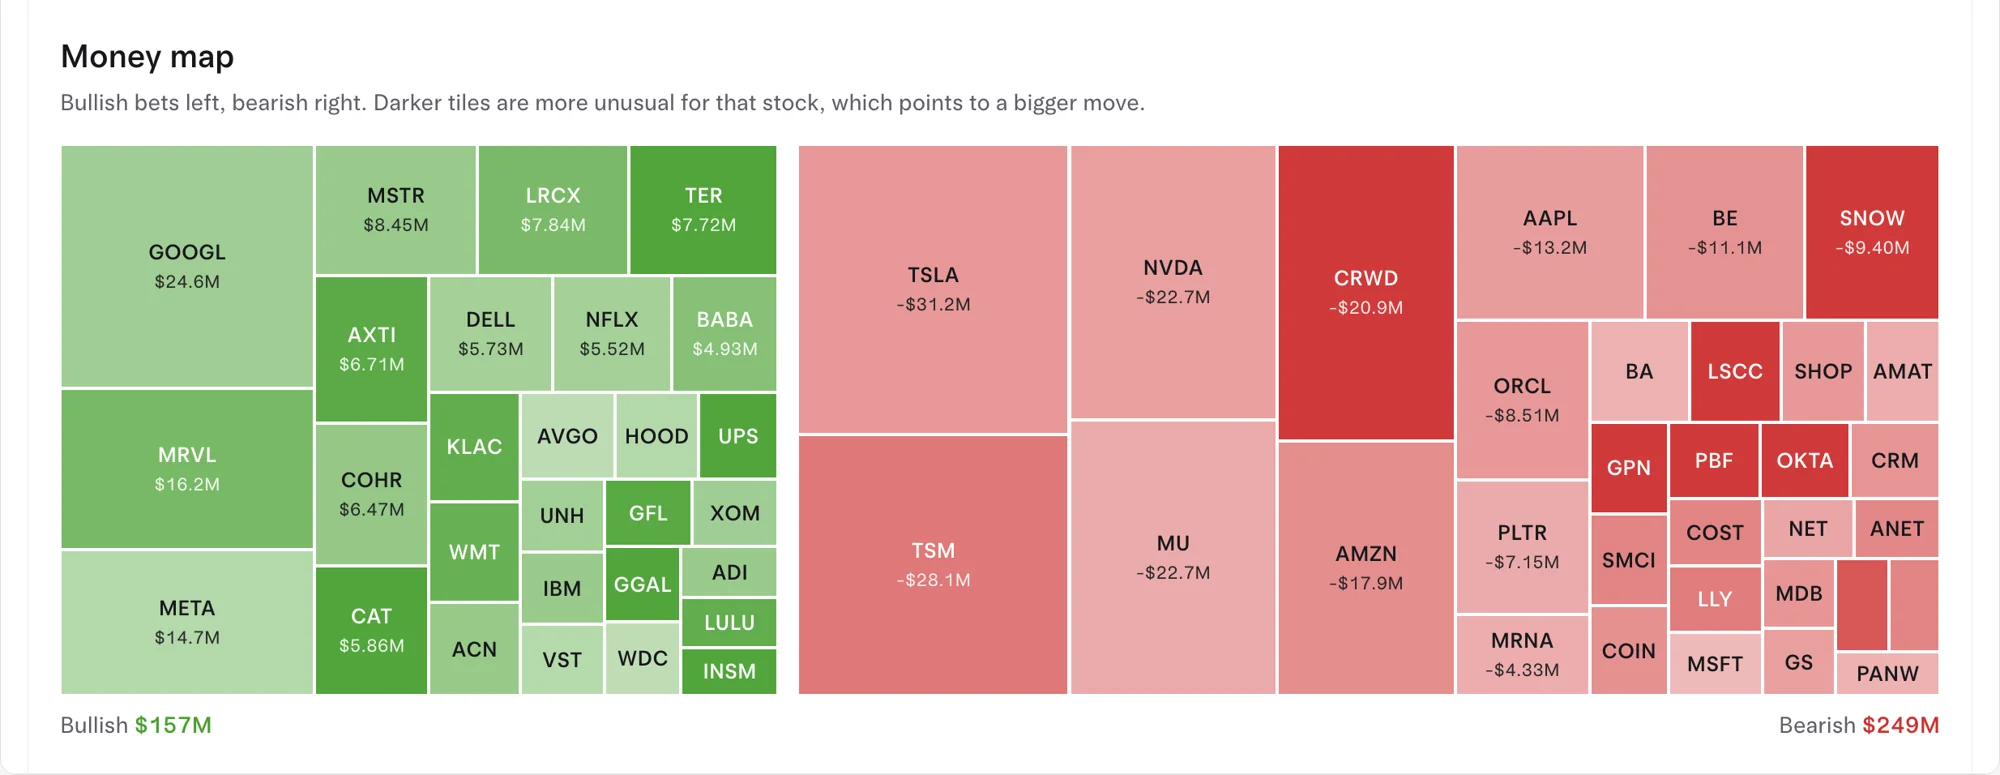
The top of the live options flow page shows net premium, bullish, bearish, calls and puts for whatever filters you set. The Options market page charts market net flow through the day against SPY, and its money map shows net premium by stock, green for bullish and red for bearish. For a single stock, the research options page (for example NVDA options) plots net flow through the day against the price and splits calls and puts into bought and sold. Free shows yesterday's session; Live and Pro update to the second.
Common questions
Is positive net premium bullish?
It means more premium leaned bullish than bearish. It describes positioning, not a forecast: SPY's net premium was bullish on a day it fell 1.59%.
Are mid-price trades included in net premium?
No. A trade at the mid gives no clue which side was more eager, so it counts for neither side, though it still adds to total calls and puts.
Why do two apps show different net flow for the same stock?
They filter different prints (large prints only, or everything), draw the bid and ask lines differently, and use different time windows. The raw trades are the same; the sorting isn't.
What counts as a big net premium?
Big relative to the stock's own usual flow and to what traded that day. Citigroup's $93.80M was 43.5% of its directional premium; Nvidia's $19.61M was 2.1%.
Sources
- OPRA: the registered processor that disseminates consolidated last sale and quotation information from the US options exchanges, the raw material for every net flow number.
- OPRA Binary Data Recipient Interface Specification (version 6.4b, August 25, 2026): a last-sale message carries the contract, volume, price and sale condition but no buyer or seller, and OPRA computes the best bid and offer that side is judged against.
- Most bullish options flow on 2026-11-02: MRVL ($22.86M net), AMZN ($15.80M net), TSLA ($12.08M net), LITE ($6.09M net), PLTR ($4.32M net).
- Most bearish options flow on 2026-11-02: AAPL ($40.91M net), AMD ($20.30M net), MU ($10.61M net), ORCL ($7.99M net), NVDA ($7.77M net).
Updated 2026-11-02 16:04 UTC