How to read spreads and multi-leg trades in the flow
By Faizan Ahmad. Updated .
A spread shows up in options flow as two or more prints in the same underlying at the same moment, usually the same size, at different strikes or expiries, and the legs must be read as one trade because the package can mean something very different from either leg alone. Match prints by time, size and expiry, check the Spread or Complex tag, then work out the net cost and the most the package can make or lose. On October 30, 2026, 5,000 SPX December 7000 calls and 5,000 December 8000 puts printed together at 10:42 AM for $535.45M; if both legs were bought, the pair was certain to be worth at least $500M at expiry, so the real bet was about $35M, not half a billion.
How do you spot a spread in the flow?
- Same underlying, same timestamp, often the same second.
- The same number of contracts per leg, or a fixed ratio like one to two.
- Different strikes, different expiries, or a call paired with a put.
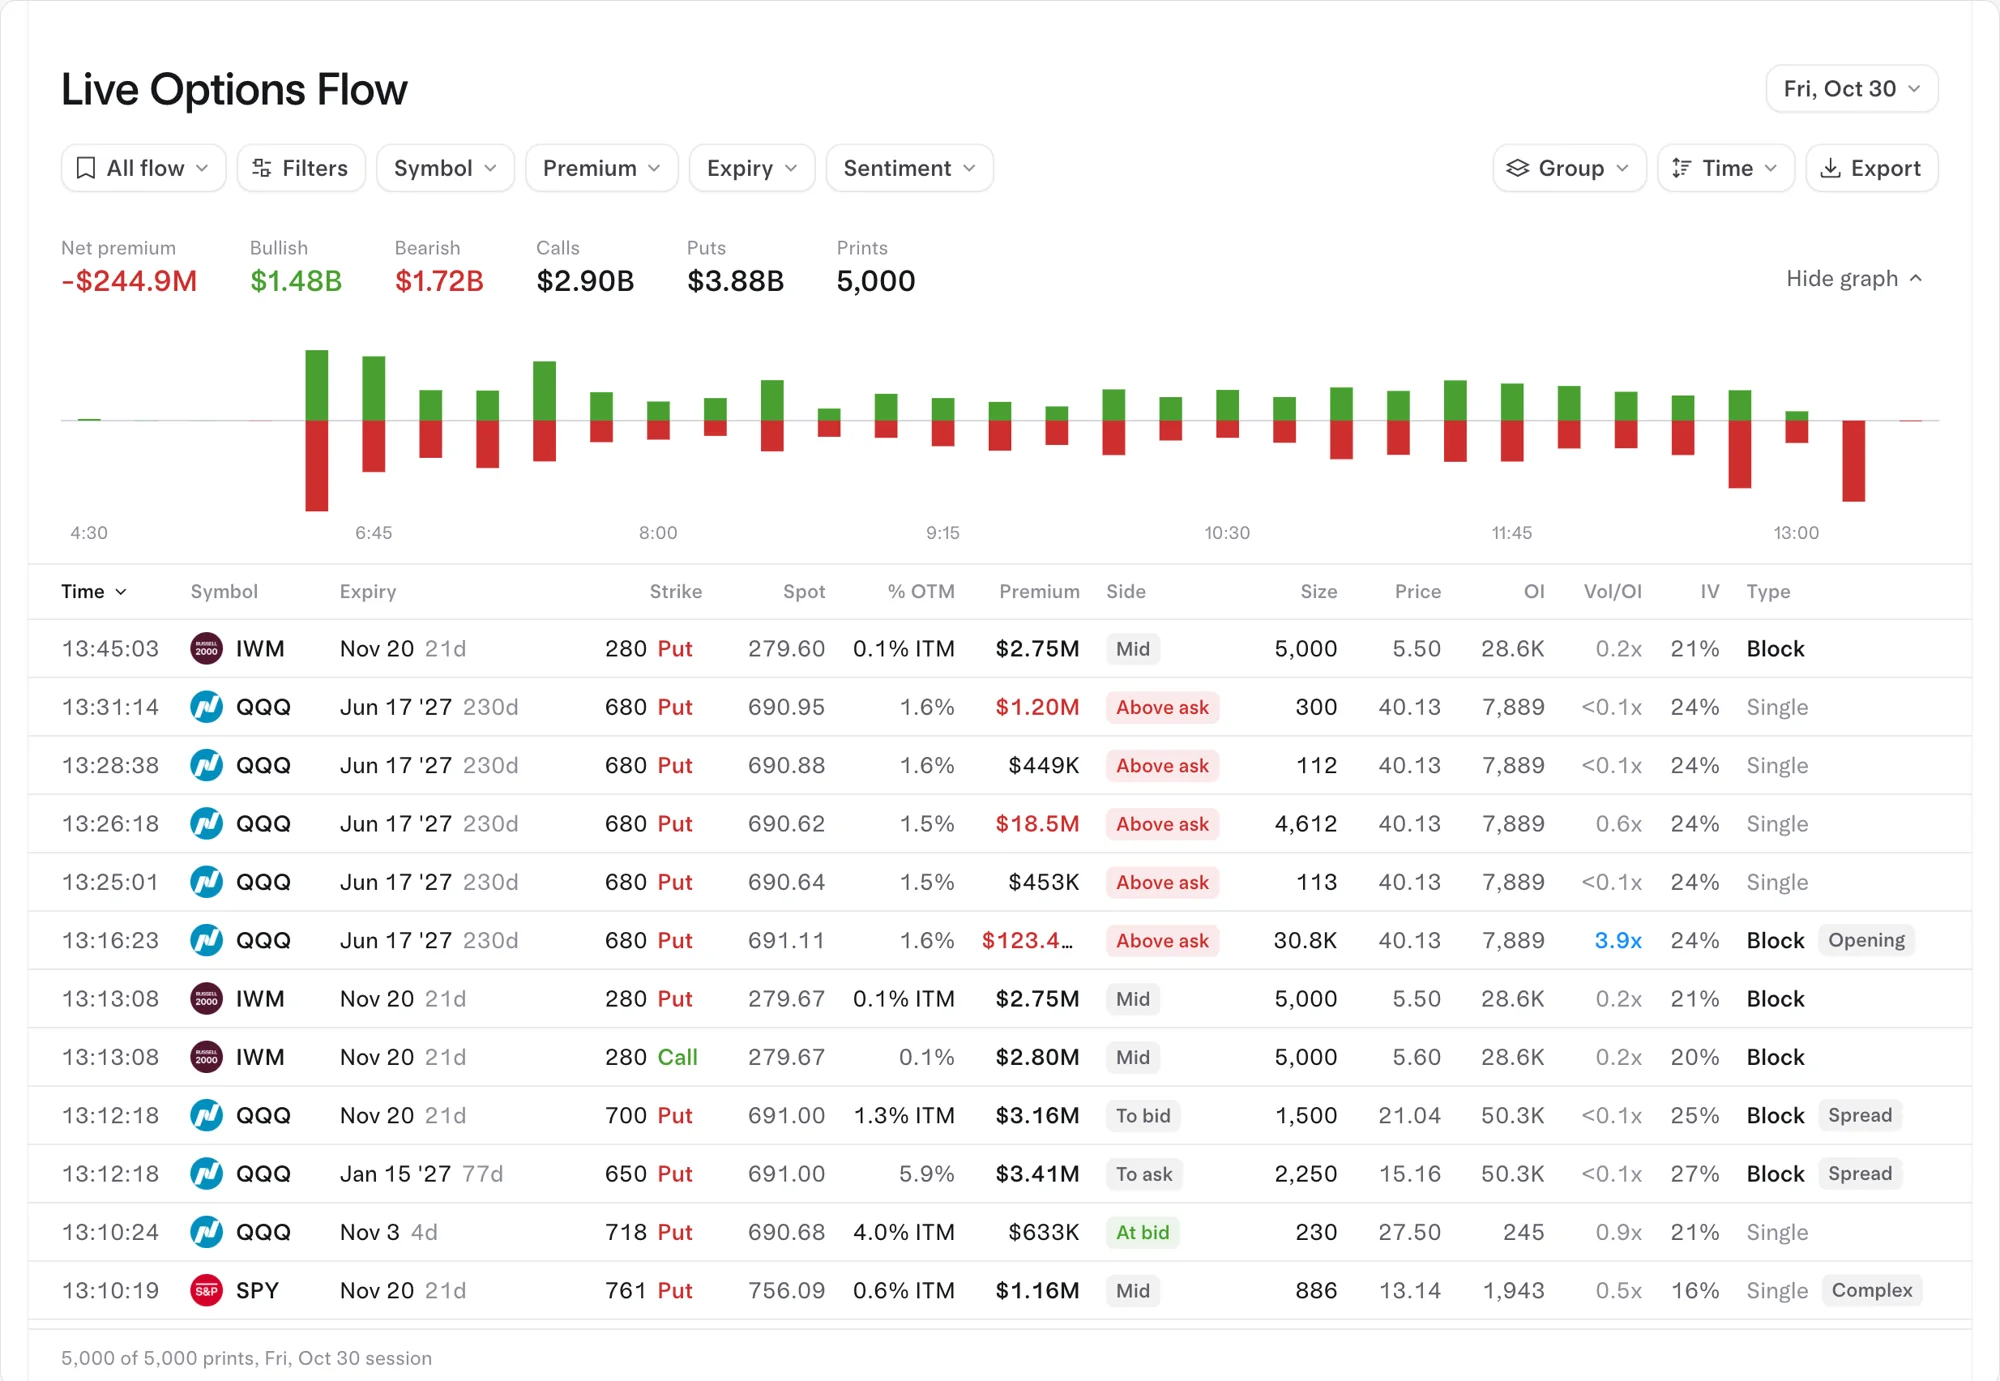
- A Spread or Complex tag, or a large leg printing at the mid.
- Sometimes a stock trade at the same moment, for stock-and-option packages.
Exchanges do flag these trades: OPRA's August 2026 data specification has separate sale conditions for multi-leg orders and for stock-and-option combinations. What the tape doesn't do is link the legs or say which leg was bought. Each leg arrives as its own print, tools match legs by symbol, time and size, and you still have to judge the direction.
What do the common spreads look like in the flow?
| Spread | How it prints | What it usually means |
|---|---|---|
| Vertical (call or put spread) | Two strikes, same expiry, same size | A directional bet with capped risk and capped payoff |
| Calendar or diagonal | Two expiries, same or different strikes | A view on time or volatility, or a roll to a later date |
| Straddle or strangle | A call and a put, same size and expiry | Bought: a bet on a big move either way. Sold: a bet on a quiet market |
| Risk reversal | Buy a call and sell a put, or the reverse | A strong directional view, paid for by the other leg |
| Butterfly or iron condor | Three or four strikes at once | A bet the price ends in, or stays inside, a range |
| Roll | Close one contract, open a later or different one | Upkeep of an existing position, not a new view |
| Stock and option | Option prints alongside a stock trade | A covered call, a protective put or another hedged position |
Worked example: the $535M SPX package
At 10:42 AM on October 30, 2026, with SPX at 7655.67, two blocks printed together (more on blocks in what is a block trade): 5,000 December 18 7000 calls for $348.68M and 5,000 December 18 8000 puts for $186.77M. Both legs were deep in the money: the call was 655.67 points in and cost 697.36 points ($69,736 a contract), the put 344.33 points in and cost 373.54. Read as two trades, that's a huge bullish call and a huge bearish put. Read as one, the meaning depends on which side each leg took:
| If the trader... | The position | What was really at stake (10:42 AM pair) |
|---|---|---|
| Bought both | A "guts" strangle: worth at least 1,000 index points ($100,000 per pair) at expiry, wherever SPX lands | Paid $535.45M for a floor of $500M: a $35.45M bet on SPX finishing well outside 7000 to 8000 |
| Sold both | The mirror image | Collected $535.45M and owes at least $500M: keeps up to $35.45M if SPX stays between the strikes |
| Bought the call, sold the put | A synthetic long, with double exposure to SPX between the strikes | A large bullish bet for a net $161.91M |
| Sold the call, bought the put | A synthetic short | A large bearish bet |
The floor in the first two rows is exact, not an estimate: SPX options are European style and cash settled, so at expiry the pair pays the call's value plus the put's value, which can't be less than the 1,000-point gap between the strikes. If it was a strangle, reading the call leg alone ($348.68M) overstates the money at risk nearly tenfold. Until you know which side each leg hit, the honest read is one large package, not a $349M call bet; the side chips on the two legs are the best clue to which row of the table it was.
Worked example: a Meta call spread
At 1:03 PM the same day, with Meta at $620.825, 4,481 February 19, 2027 $730 calls traded for $10.59M, bought at the ask, against open interest of only 793. In the same minute, 4,481 February 2027 $780 calls traded for $6.60M. Same size, same expiry, $50 apart: the shape of a bull call spread.
If the $780 calls were sold, the trader paid about $3.99M net, roughly $8.90 a share. The spread is worth at most $50 a share, $22.41M in total, if Meta is at or above $780 on February 19, 2027, and it breaks even near $738.90. As a single leg, the $730 call looks like a $10.59M bullish bet. As a spread, the money at risk is about $3.99M and the upside is capped. One more clue: the $780 leg was smaller than its open interest of 12,819, so it may have closed an older position, which would make the whole trade a roll rather than a new view.
Longer-dated packages look the same. At 12:15 PM, 1,455 AMD January 2028 $340 puts ($4.70M) printed with 1,455 June 2028 $310 puts ($4.49M): two expiries and two strikes, a diagonal, so neither leg says much alone. Long-dated put packages are often hedges; see how to tell if a big trade is a hedge.
How do you read a spread, step by step?
- Group the legs: same symbol, same time, matching size.
- Find the leg that was likely bought. In a debit spread it's usually the more expensive one. Check each leg's side chip, but trust the package over any one leg: legs trade at a combined price, so a single leg's side can mislead.
- Work out the net: premium of the bought legs minus premium of the sold legs.
- Work out the most it can make and lose. For a vertical, the width between strikes times 100 times the contracts is the most it can be worth; subtract the net cost.
- Name the view: direction, a range, volatility or time.
- Check open interest. A leg smaller than its open interest may be closing an old position, which turns the trade into a roll. Opening vs closing explains the next-day check.
How to see it on Tradytics
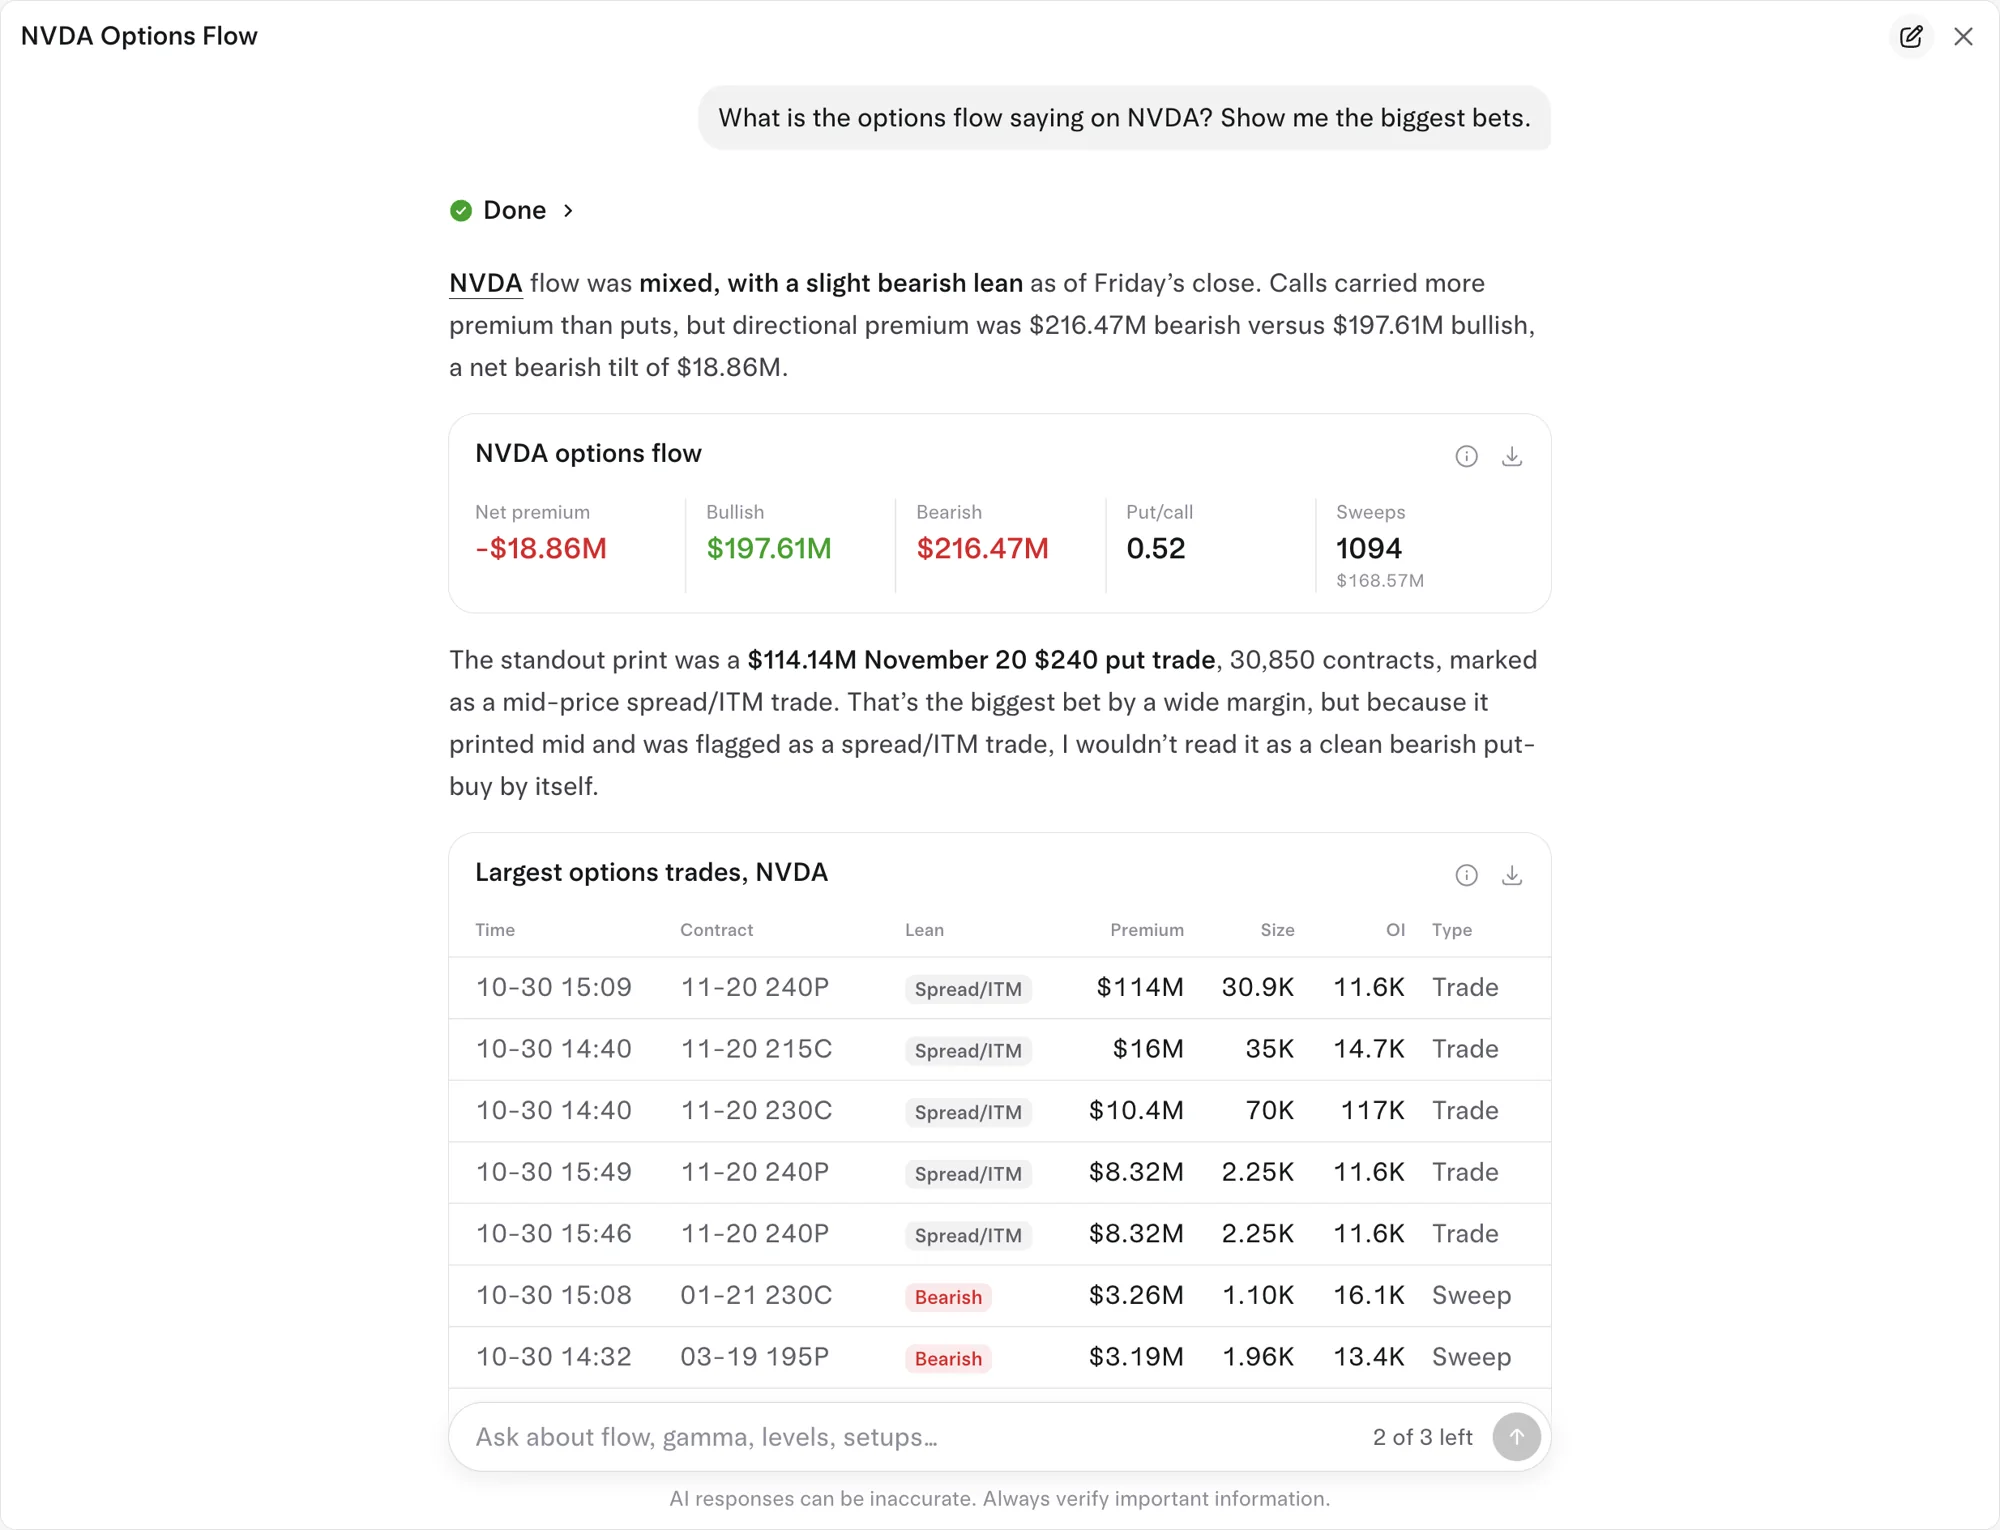
On the live options flow page, prints that belong to multi-leg trades carry a Spread or Complex tag, and sorting by time puts the legs next to each other. The AI analyst does this reading for you: asked for Nvidia's biggest bets, it flagged that the largest print, $114M in November 20 $240 puts, was a mid-price spread rather than a clean bearish bet. To see what any spread pays at every price and date, rebuild it in the options strategy builder; how to use the strategy builder walks through it.
Common questions
Is a spread bullish or bearish?
It depends on the structure. A call debit spread or a put credit spread leans bullish; a put debit spread or a call credit spread leans bearish; straddles, strangles and condors are bets on how much the price moves, not which way.
Can you tell which leg was bought?
Only by inference: each leg's side chip, its price against the bid and ask, and which leg costs more. The exchange tape doesn't record it.
Do spreads count in net premium?
Each leg counts by its own side, and legs at the mid count for neither, so a spread can tilt the net premium even when the package is mostly hedged.
Sources
- OPRA Binary Data Recipient Interface Specification (version 6.4b, August 25, 2026): sale-condition codes for multi-leg trades (electronic, auction, cross, floor, against single legs) and stock-and-option trades; each last-sale message describes one contract.
- Cboe: S&P 500 Index Options: SPX options are European style (exercised only at expiration), cash settled, with a $100 multiplier.
- Most bullish options flow on 2026-11-02: MRVL ($23.33M net), AMZN ($16.59M net), TSLA ($12.07M net), LITE ($6.09M net), PLTR ($4.19M net).
- Most bearish options flow on 2026-11-02: AAPL ($40.88M net), AMD ($20.37M net), MU ($10.45M net), NVDA ($7.79M net), ORCL ($7.77M net).
Updated 2026-11-02 16:05 UTC