How to use the Tradytics options strategy builder
By Faizan Ahmad. Updated .
Open Builder (tradytics.com/builder), search a ticker, then either pick an outlook (Up, Down, Big move or Stays put) and a ready-made strategy, or tap prices on the live options chain to add legs yourself. Tradytics shows what the position can make and lose, where it breaks even, its chance of ending in profit, a payoff chart at expiry and before, and a profit and loss grid by price and date. The builder is on every plan, Free included.
What do you see when you open the builder?
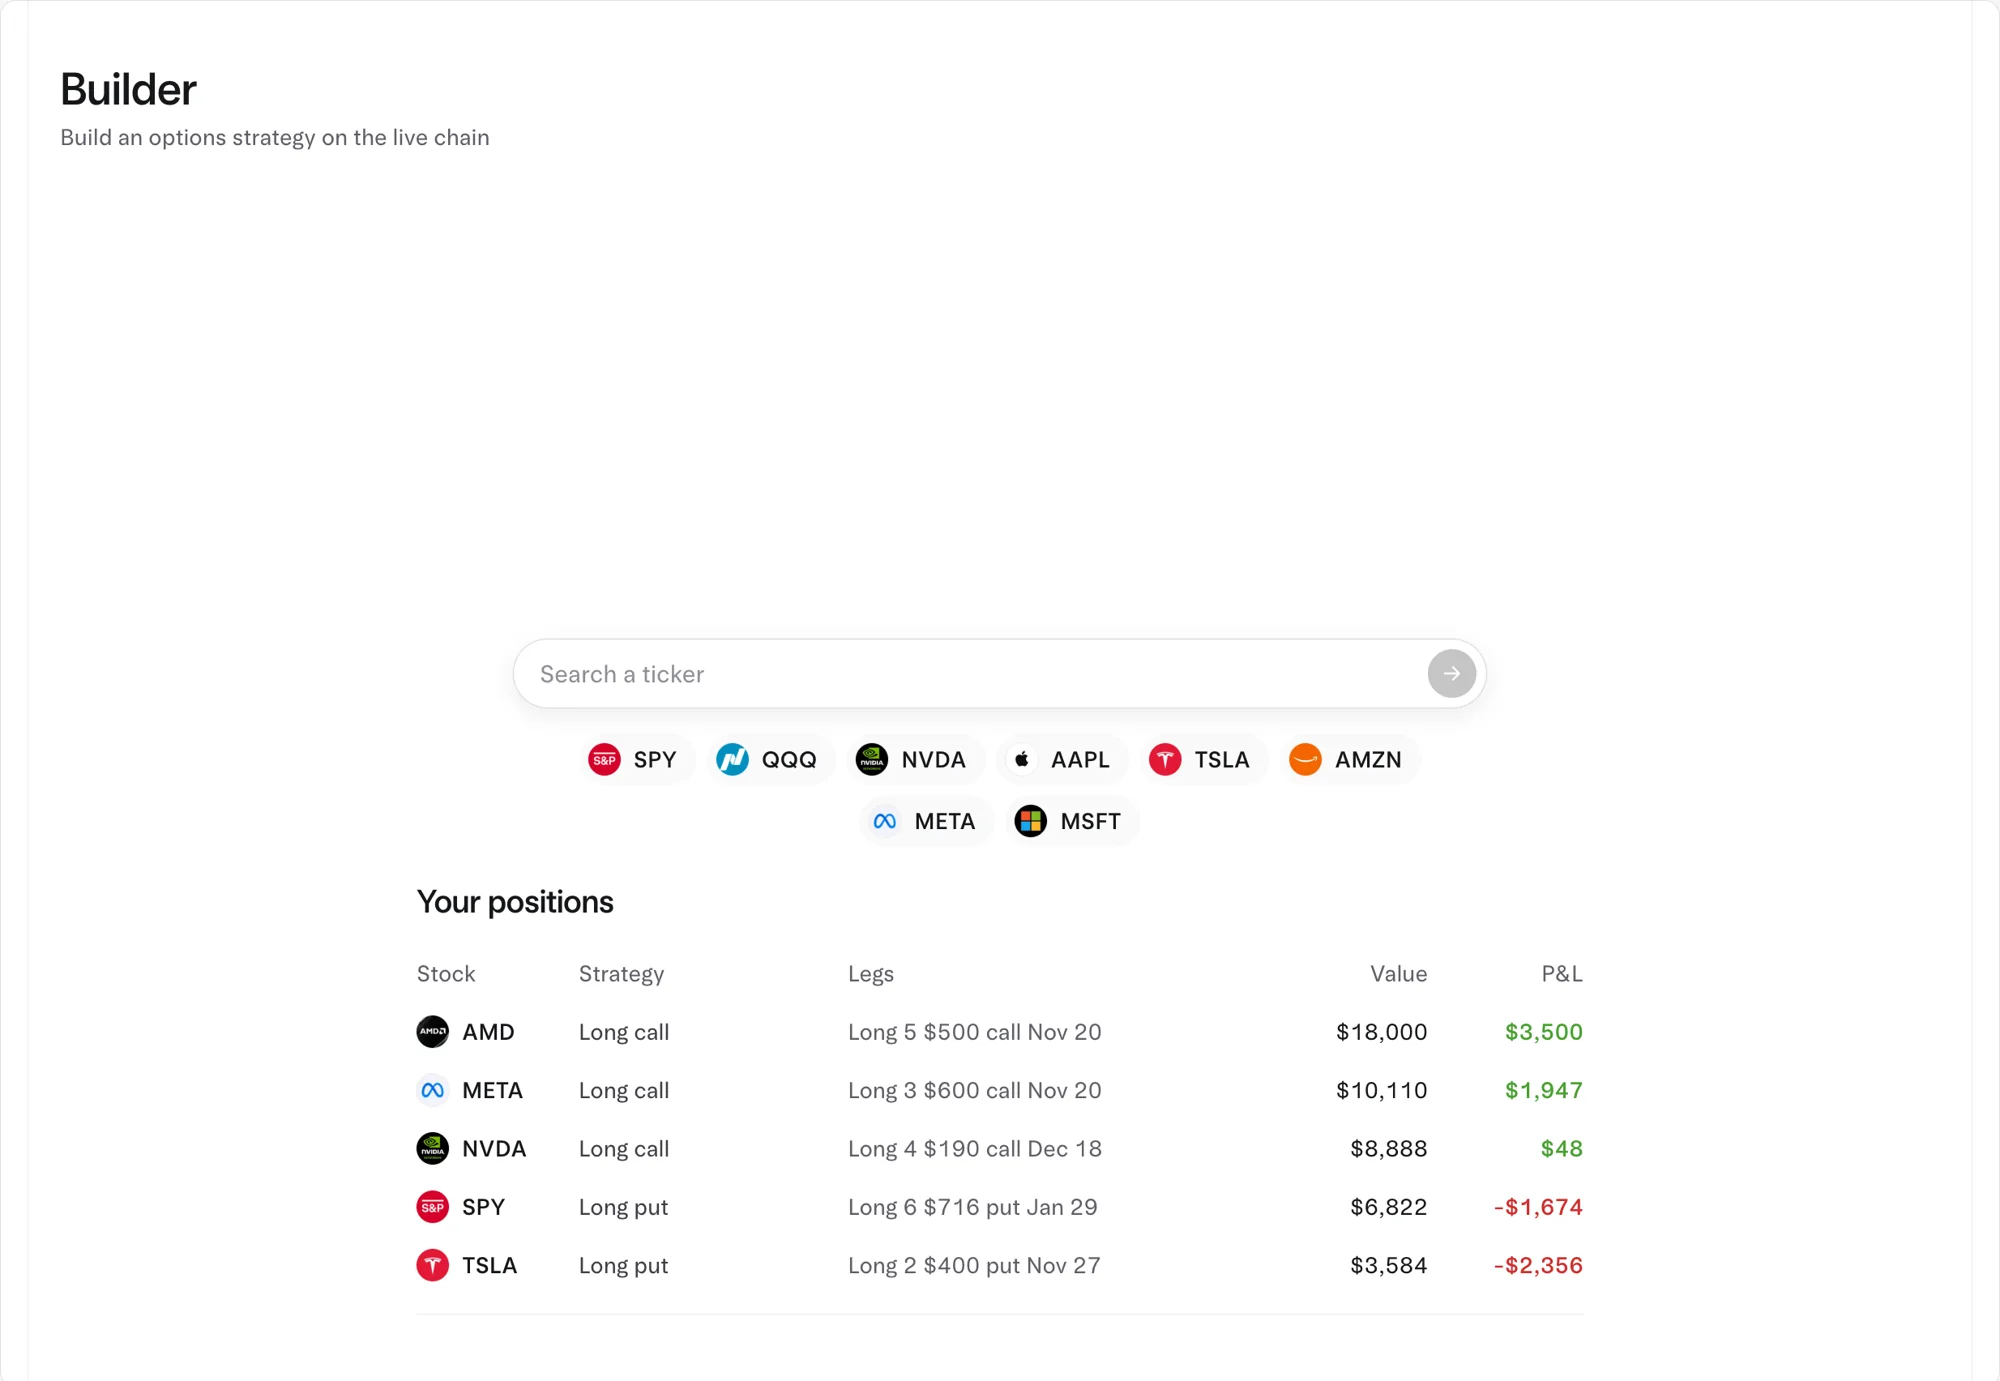
- Search a ticker: type a stock or ETF symbol. Typing a letter anywhere on the page opens the search too.
- Quick picks: the tickers you looked at lately, then the most traded ones (SPY, QQQ, NVDA, AAPL, TSLA, AMZN, META, MSFT).
- Your positions: with a brokerage linked through the portfolio tracker, the options you hold, one row per stock with the strategy, legs, value and P&L. A tap loads the position at what it cost, so you can see where it stands and what it does from here.
How do you build an options strategy on Tradytics?
- Pick the ticker. The chain opens with every listed expiry in a strip across the top, each with its days to go.
- Pick an expiry. Tap a date to see its chain.
- Add legs, one of two ways. Pick an outlook and a strategy card, which places the legs around today's price, or use the chain: calls on the left, puts on the right, strikes down the middle. Tap an ask to buy, tap a bid to sell. A leg can be dragged up or down to change the strike and sideways to change the expiry.
- Adjust the legs. The strategy table names what you built (or says Custom) and shows its cost or credit. Each leg has buy/sell and call/put chips that flip on a click, a quantity stepper, the strike and the date.
- Read the outcome. Max profit, max loss, breakeven and chance of profit sit over the payoff chart, with the profit and loss grid below.
- Share or clear. Share copies a link that rebuilds the exact strategy. Clear starts over.
On the chain, each side shows Odds (an estimate of the chance that contract finishes in the money), open interest, volume, bid and ask. When the market is closed, the builder notes that quotes are from the last close.
Which strategies can you start from?
Every card shows the payoff's shape and one line on what it does. You can also build anything else leg by leg.
| Outlook | Strategies | What they do |
|---|---|---|
| Up | Long call, bull call spread, bull put spread, covered call, cash-secured put | Profit from a rise, pay less for a capped rise, or get paid if the stock stays above a price |
| Down | Long put, bear put spread, bear call spread | Profit from a fall, pay less for a capped fall, or get paid if the stock stays below a price |
| Big move | Long straddle, long strangle | Profit from a big move either way |
| Stays put | Iron condor, butterfly, calendar spread | Get paid if the stock stays in a range or near one price |
What do max profit, max loss, breakeven and chance mean?
- Max profit and max loss: the most the position can make and lose at expiry. For a bought call or put, the max loss is what you paid.
- Breakeven: the stock price where the position neither makes nor loses money at expiry. For a long call, the Options Industry Council puts it simply: strike plus premium.
- Chance: the estimated chance the position ends in profit.
- Payoff chart: P&L across stock prices at expiry (green above zero, red below), a thin line for P&L on the date you pick with the date ruler, a line at today's price and rings at the breakevens. Press and drag the target to read the P&L at any price.
- Profit and loss by date: a grid of stock prices (rows) by dates up to expiry (columns), green for a gain and red for a loss, deeper as it grows. Use it to answer "what if the stock is at X on Friday?"
Worked example: the NVDA $180 call block from October 30, 2026
At 11:55 AM on October 30, 2026, a block of 52,800 NVDA January 15, 2027 $180 calls traded for $172.81M in premium, with NVDA at $205.81. Dividing out the size gives the price per call: $172.81M / 52,800 contracts / 100 shares = about $32.73 a share, or $3,273 per contract.
Say you bought one of those calls at that price. In the builder you would load NVDA, pick the January 15, 2027 expiry, and tap the $180 call's ask. The outcome would read:
- Max loss: $3,273, the premium, if NVDA ends at or below $180.
- Breakeven at expiry: $180 plus $32.73, or $212.73.
- What you paid for: about $25.81 of that price was already in the money ($205.81 minus $180). The other $6.92 or so is time value, which decays toward zero by expiry.
The date ruler and the grid then show the same call before expiry, when time value is still in the price. The builder uses today's live chain, so the numbers you see on another day will differ; the method doesn't. For what a block is, see what a block trade in options is.
A short routine before you place an options trade
- Check the stock's expected move and implied volatility on its research options page (for example NVDA options).
- Build the strategy for the expiry you want.
- Compare your breakeven with the expected move. A breakeven far outside it needs a bigger move than options are pricing.
- Read the profit and loss grid on the date you plan to exit, not just at expiry.
- Check max loss against what you're willing to lose on one idea.
- Share the link with a friend, or ask the AI analyst about the stock's flow and levels before you trade it at your broker.
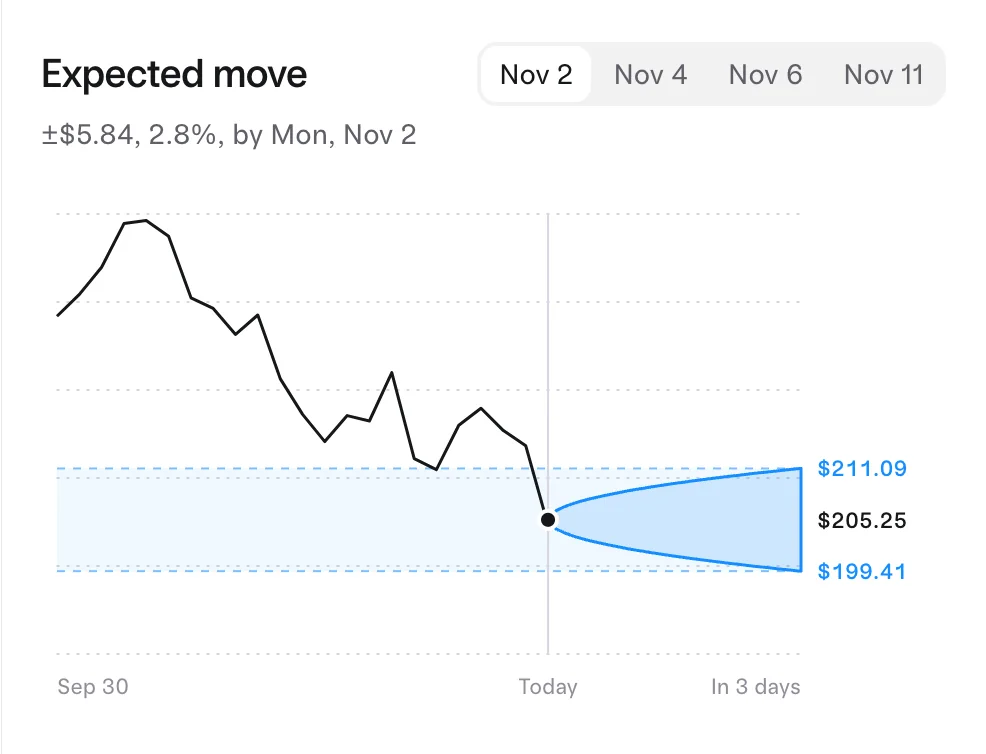
More on the inputs: what the expected move is and IV crush, which can sink a bought option even when you get the direction right.
Which plans include the builder?
| Free | Live | Pro | |
|---|---|---|---|
| Price | $0 | $39 a month or $299 a year | $69 a month or $499 a year |
| Options strategy builder | Yes | Yes | Yes |
| Your positions (broker link) | Yes | Yes | Yes |
| Options flow | Yesterday's session | Live, to the second | Live, to the second |
Common questions
Is the Tradytics options strategy builder free?
Yes. The builder is on every plan, Free included.
Can I place trades from the builder?
No. The builder models strategies, and broker links on Tradytics are read only, so you place the trade at your broker.
Can I see what my position is worth before expiry?
Yes. Move the date ruler to see the payoff line on any date before expiry, or read the profit and loss grid by price and date.
Can I load the options I already hold?
Yes. With a brokerage linked, Your positions on the start screen lists them, and a tap loads one at what it cost.
What does the Odds column on the chain mean?
It is an estimate of the chance that contract finishes in the money at expiry. It is not the chance your whole strategy makes money; that is the Chance figure over the payoff chart.
Sources
- Options Industry Council: Long Call, which gives a long call's breakeven as strike plus premium and its maximum loss as the amount paid.
- Options Industry Council: Volatility & the Greeks, on implied volatility as the market's expected move read from option prices.