How to link your broker and track your portfolio on Tradytics
By Faizan Ahmad. Updated .
Open Portfolio (tradytics.com/portfolio), click Connect a brokerage and sign in to your broker in the window that opens. The link is read only and free on every plan, and it works with Robinhood, Schwab, Fidelity, Interactive Brokers, Webull, tastytrade and more. Tradytics then shows your stocks, options, crypto and cash in one place, matches a year of trades into round trips, and shows your P&L by month, by day and by position.
How do you link a brokerage to Tradytics?
- Open Portfolio from the left menu. Until something is linked, the page shows a card called Link your portfolio.
- Click Connect a brokerage to choose from the full list, or click your broker under "Or go straight to your broker".
- Sign in to your broker in the window that opens. Connections go through SnapTrade with read-only access: your login stays with your broker, and Tradytics can't place trades or move money.
- Wait a moment for your accounts to come in. Link more brokers the same way. The All accounts menu at the top right shows everything together or one account at a time.
If a link stops updating, the Accounts card has a Reconnect button, and Disconnect removes a broker at any time. FINRA's advice for any app that reads your accounts applies here too: know what access you grant, and revoke it when you stop using the service.
What does the Tradytics portfolio page show?
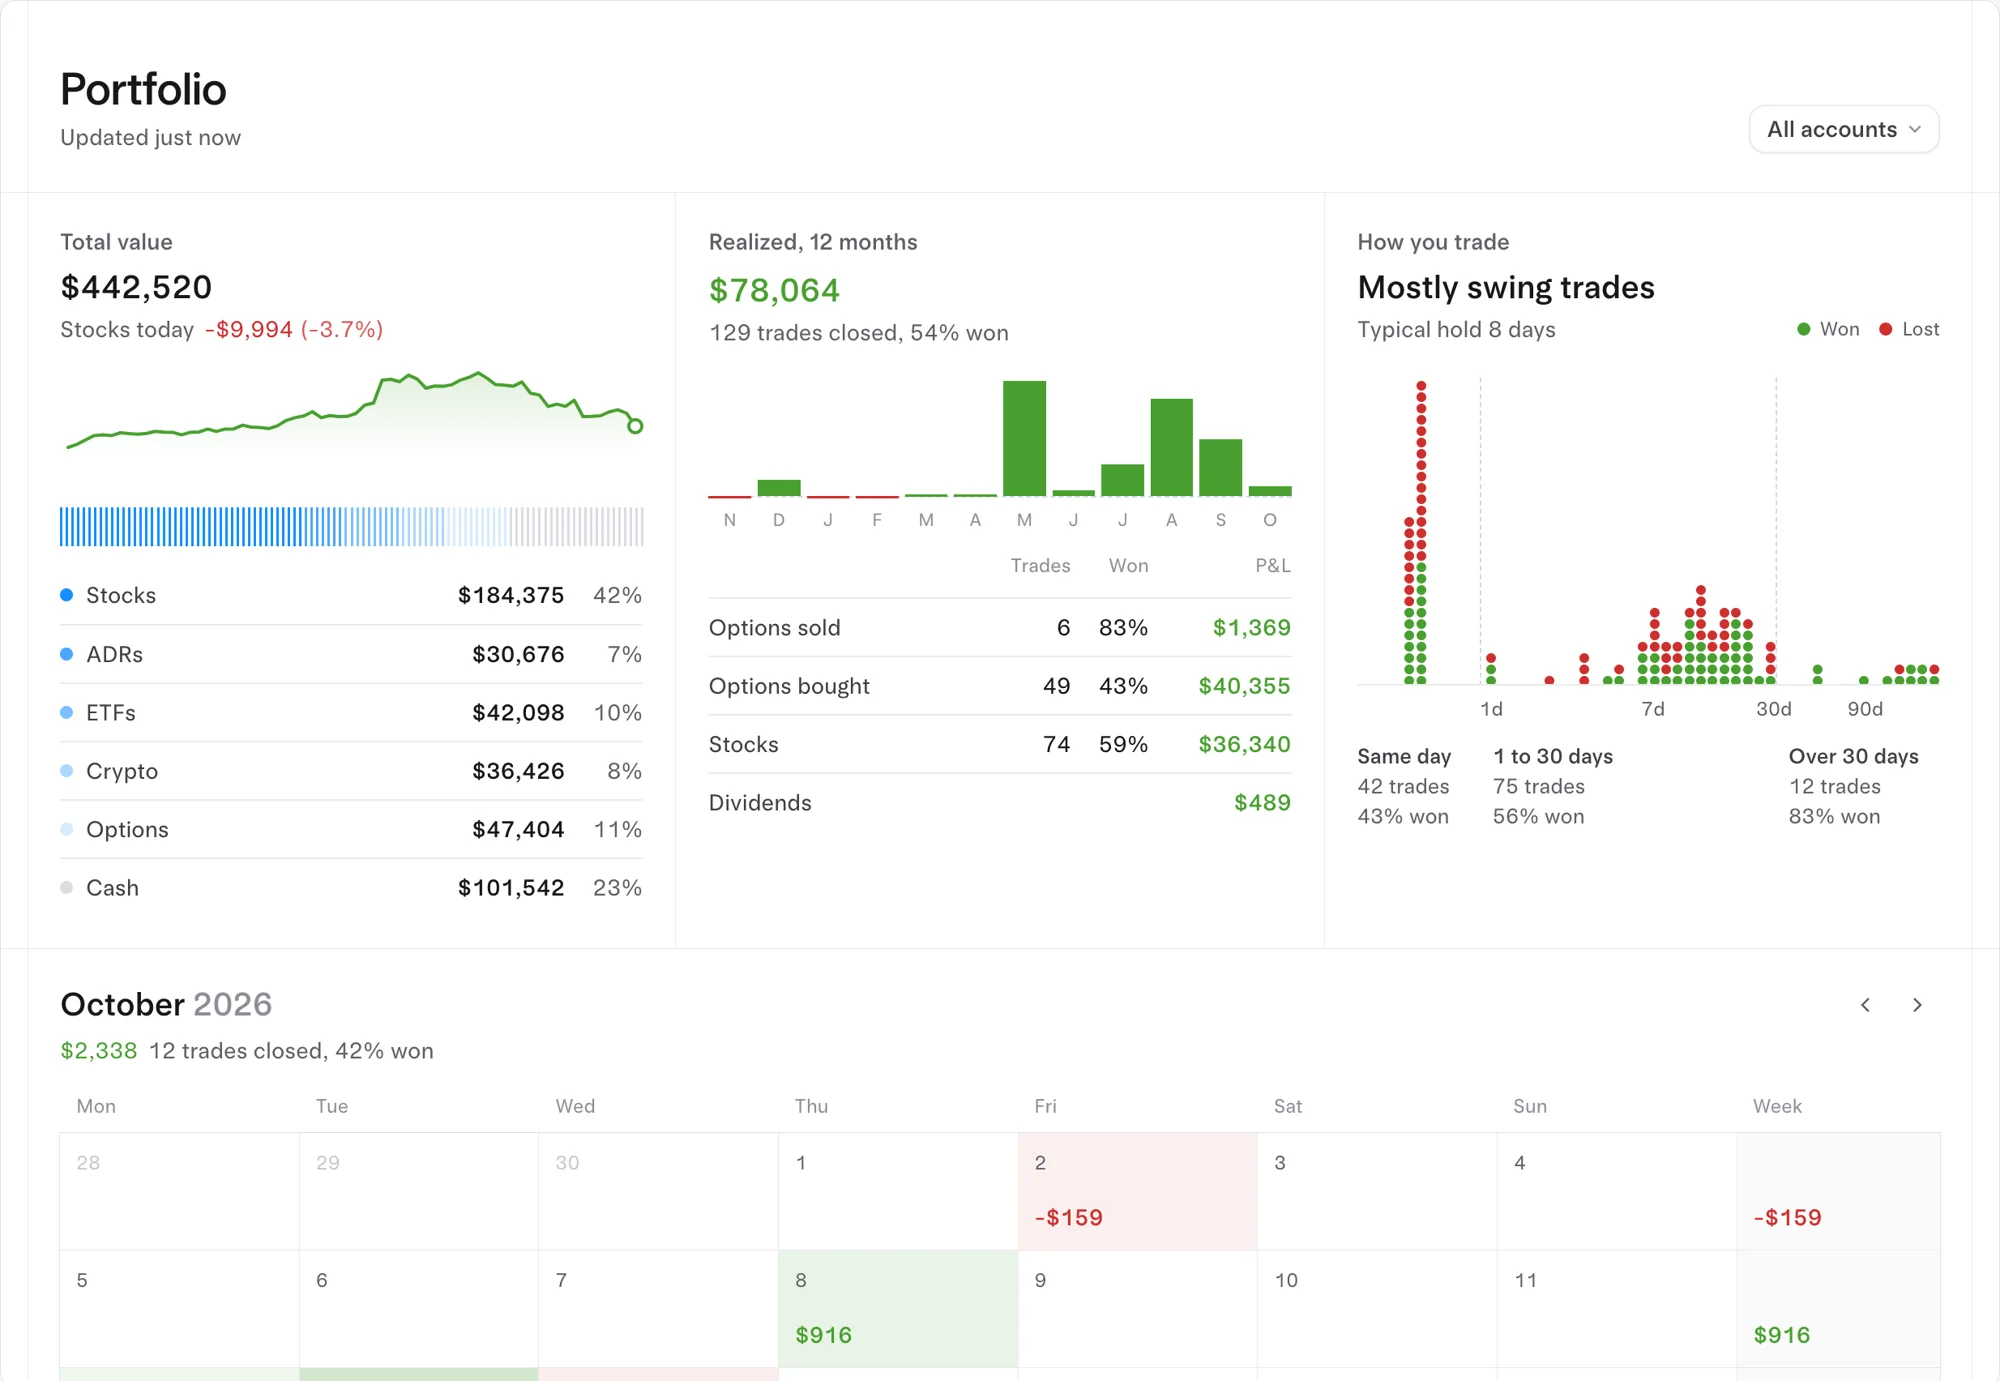
The page reads top to bottom, from what you own to how you trade it.
| Section | What it shows | What to look for |
|---|---|---|
| Total value | Everything you hold, today's change on your stocks, a value chart, and the split by stocks, ADRs, ETFs, crypto, options and cash with dollars and weight | Cash or one asset type taking more room than you meant |
| Realized, 12 months | P&L on closed trades over the past year, trades closed and the share that won, bars by month, and rows for options sold, options bought, stocks and dividends | Which kind of trade actually made the money |
| How you trade | A one-line read of your style (for example "Mostly swing trades"), your typical hold, every closed trade as a dot by holding time (green won, red lost), and win rates for same day, 1 to 30 days and over 30 days | The holding time where you win most often |
| Month calendar | Realized P&L for each day and each week, with trades closed and win rate for the month; arrows step back through earlier months | Red weeks, and what you traded on those days |
| Holdings | Tabs for Stocks, Options, Trades and Orders; the stock table has quantity, average cost, price, today's move, day P&L, value, weight, total P&L and return, with type and sector filters, a heat map view, sorting and Export | The positions that carry the most weight and the most risk |
What do round trips, realized P&L and win rate mean?
A round trip is a trade from open to close: a buy matched with the sell that closes it, or, for options you sold, the sale matched with the buy that closes it. Tradytics matches a year of your trades this way, so every closed trade has one P&L and one holding time. That is what powers the Realized card, the How you trade chart and the calendar.
Realized P&L counts only closed trades. This matches how the IRS treats gains: a gain or loss counts when you sell. Positions you still hold show their gain or loss in the holdings table under Total P&L and Return instead.
Win rate is the share of closed round trips that made money. On its own it misleads. A win rate under 50% can still make money if the winners are bigger than the losers, so always read it next to the P&L in the same row.
The Today and Day P&L columns earn their place on bad days. On October 30, 2026, the S&P 500 fell 1.59% while AMD fell 10.28% and the AI chip group 9.29%. On a day like that, sort the holdings by Day P&L and you see at once which positions did the damage and whether it was one stock or the whole book.
A 10-minute weekly portfolio routine
- Check Total value and the split. Is cash, crypto or options a bigger slice than you planned?
- Read How you trade. Does your typical hold match the trader you think you are? If one holding-time bucket wins far more often than the others, that is where your edge has been so far.
- Scan the calendar for red weeks, then open the Trades tab to see what you traded on those days.
- Sort the holdings by weight. Anything near the top that you wouldn't buy today deserves a second look.
- Look up your biggest positions on their research pages, or ask the AI analyst about them by ticker: options flow, dark pool levels, why it's moving.
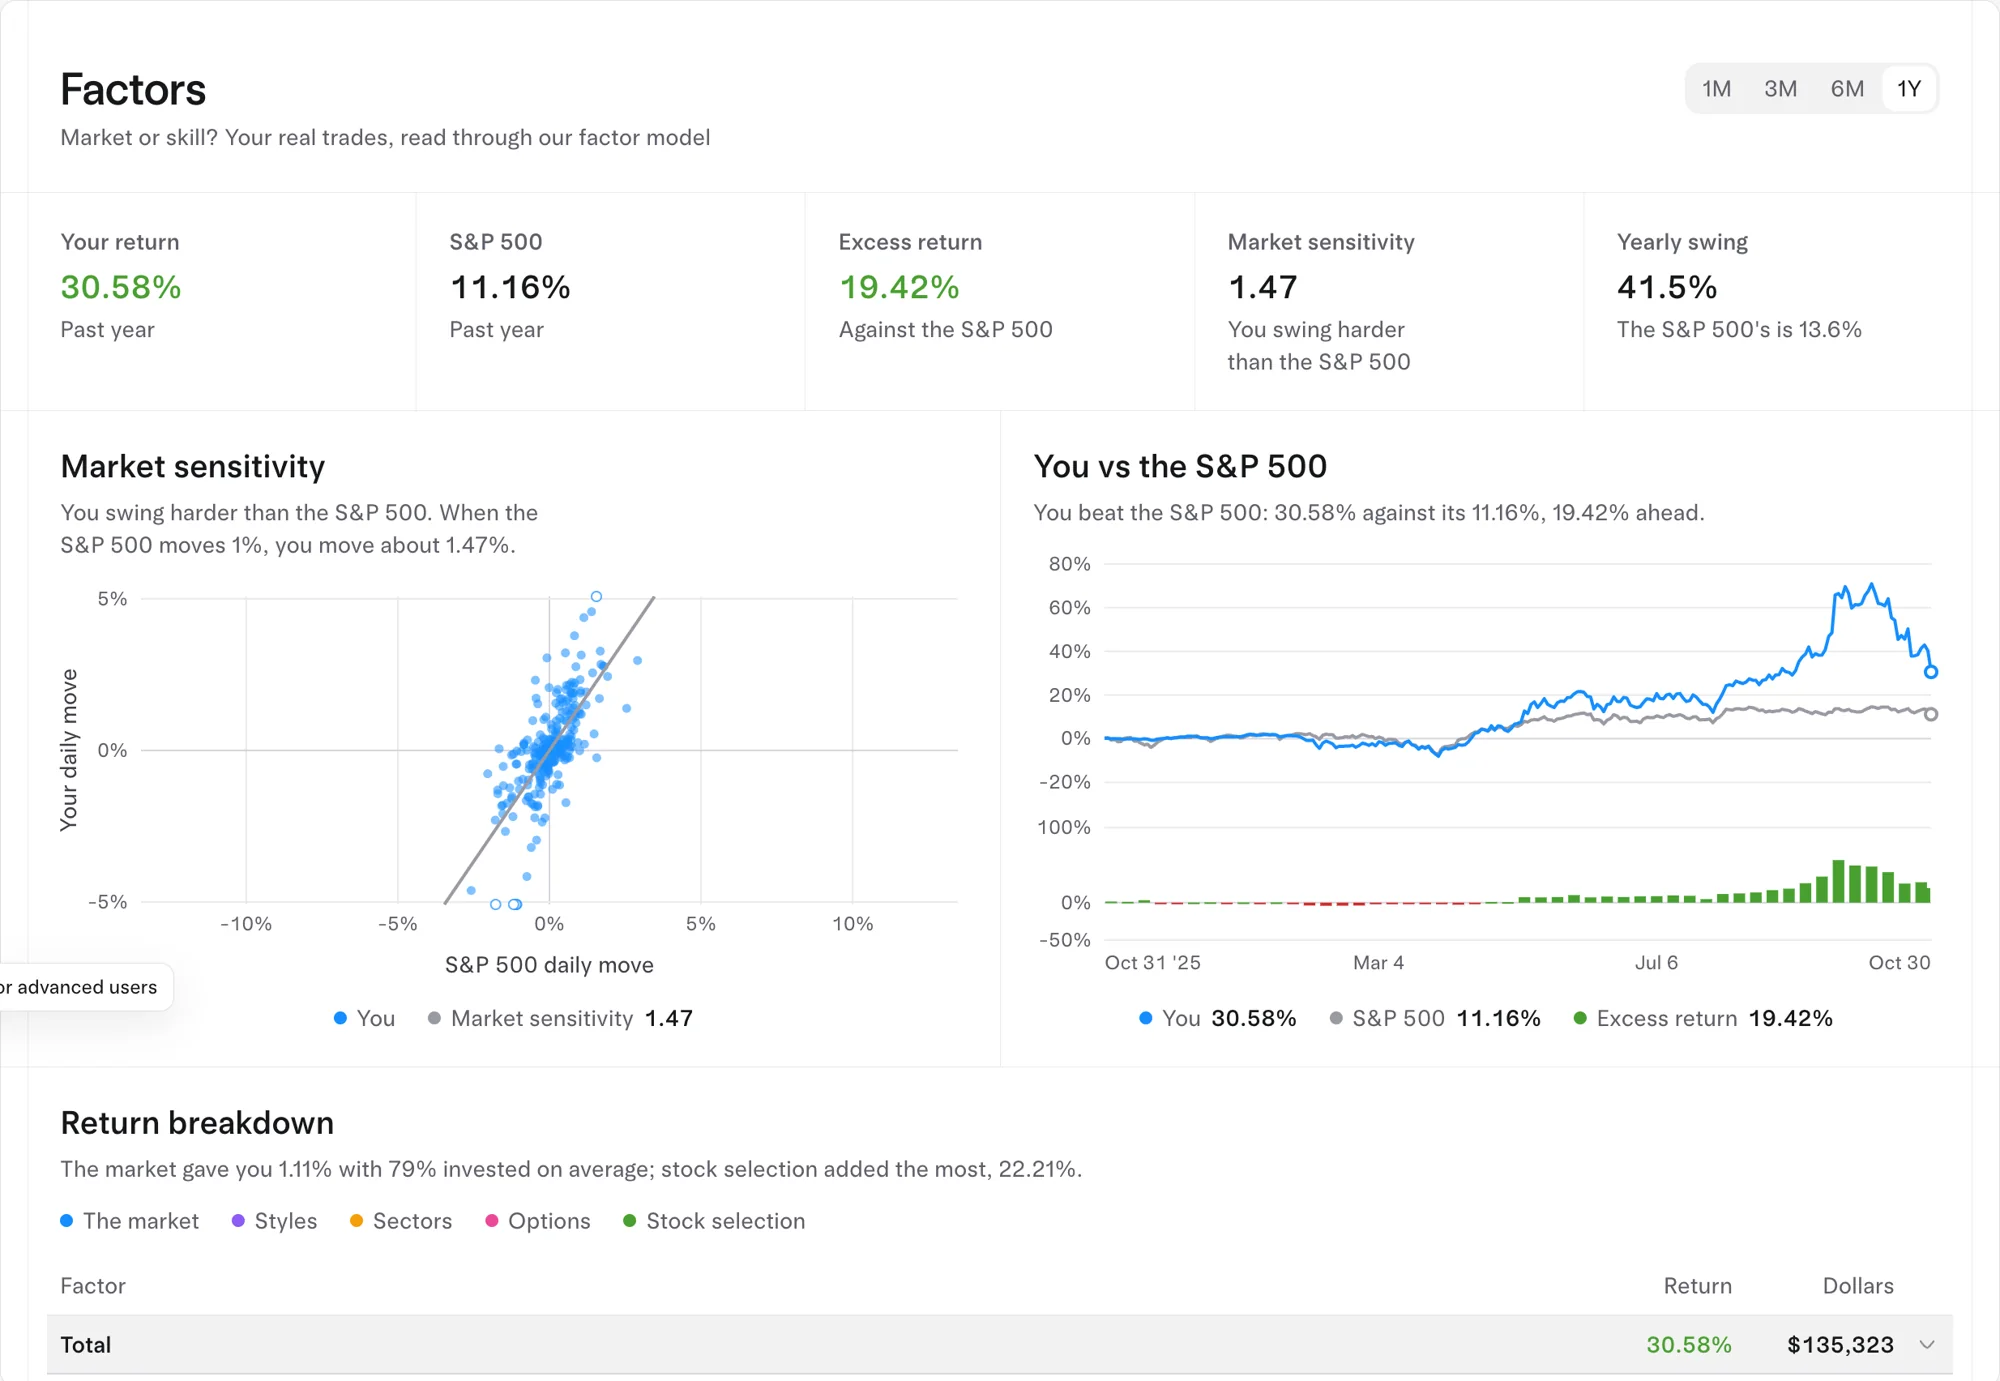
- Once a month on Live or Pro, open Factors to see whether you beat the market or just rode it, and Versus to see how your holdings compare with it.
Your options positions also show up in the builder. Open the options strategy builder with a broker linked, and Your positions lists each one; a tap loads it at what it cost, so you can see its payoff and P&L by date.
Which Tradytics plan includes the portfolio tracker?
Every plan, Free included. Live and Pro add the two analysis tabs.
| Free | Live | Pro | |
|---|---|---|---|
| Price | $0 | $39 a month or $299 a year | $69 a month or $499 a year |
| Broker link and portfolio tracker | Yes | Yes | Yes |
| Portfolio factors and versus | No | Yes | Yes |
| Options flow | Yesterday's session | Live, to the second | Live, to the second |
| AI analyst | 3 questions a day | 20 questions a day | Unlimited |
See Tradytics pricing for the full plan table, or what the Free plan includes.
Common questions
Can Tradytics trade in my brokerage account?
No. The connection goes through SnapTrade with read-only access, so Tradytics can see positions and trades but can't place trades or move money.
Which brokers can I link?
Robinhood, Schwab, Fidelity, Interactive Brokers, Webull, tastytrade and more. Connect a brokerage opens the full list.
Is the Tradytics portfolio tracker free?
Yes. Linking a broker and tracking your portfolio work on every plan, Free included. Factors and Versus need Live ($39 a month) or Pro ($69 a month).
Does it track options and crypto?
Yes. It shows stocks, options, crypto and cash, and it matches a year of trades into round trips with their P&L.
Can I link more than one broker?
Yes. Link each one the same way; the All accounts menu shows them together or one at a time.
Sources
- FINRA: Know Before You Share: Be Mindful of Data Aggregation Risks, on what to check before linking accounts to an app and why to revoke access when you stop using it.
- IRS Topic 409: Capital gains and losses, on gains and losses counting when you sell, and short-term vs long-term holding periods.