How your portfolio compares with the market: Tradytics versus
By Faizan Ahmad. Updated .
Open Portfolio, then Versus (tradytics.com/portfolio/versus, on Live and Pro). It takes your linked holdings, looks through ETFs to the stocks inside them, and shows your portfolio's weighted average on 28 metrics beside the US market: valuation, profitability, growth, balance sheet, income, technicals, options and dark pools. Eight tiles at the top give the verdict in plain words, such as "Pricier than the market" or "Less debt", and every metric below shows three bars: you, the US market and a typical stock.
What does the Versus page show?
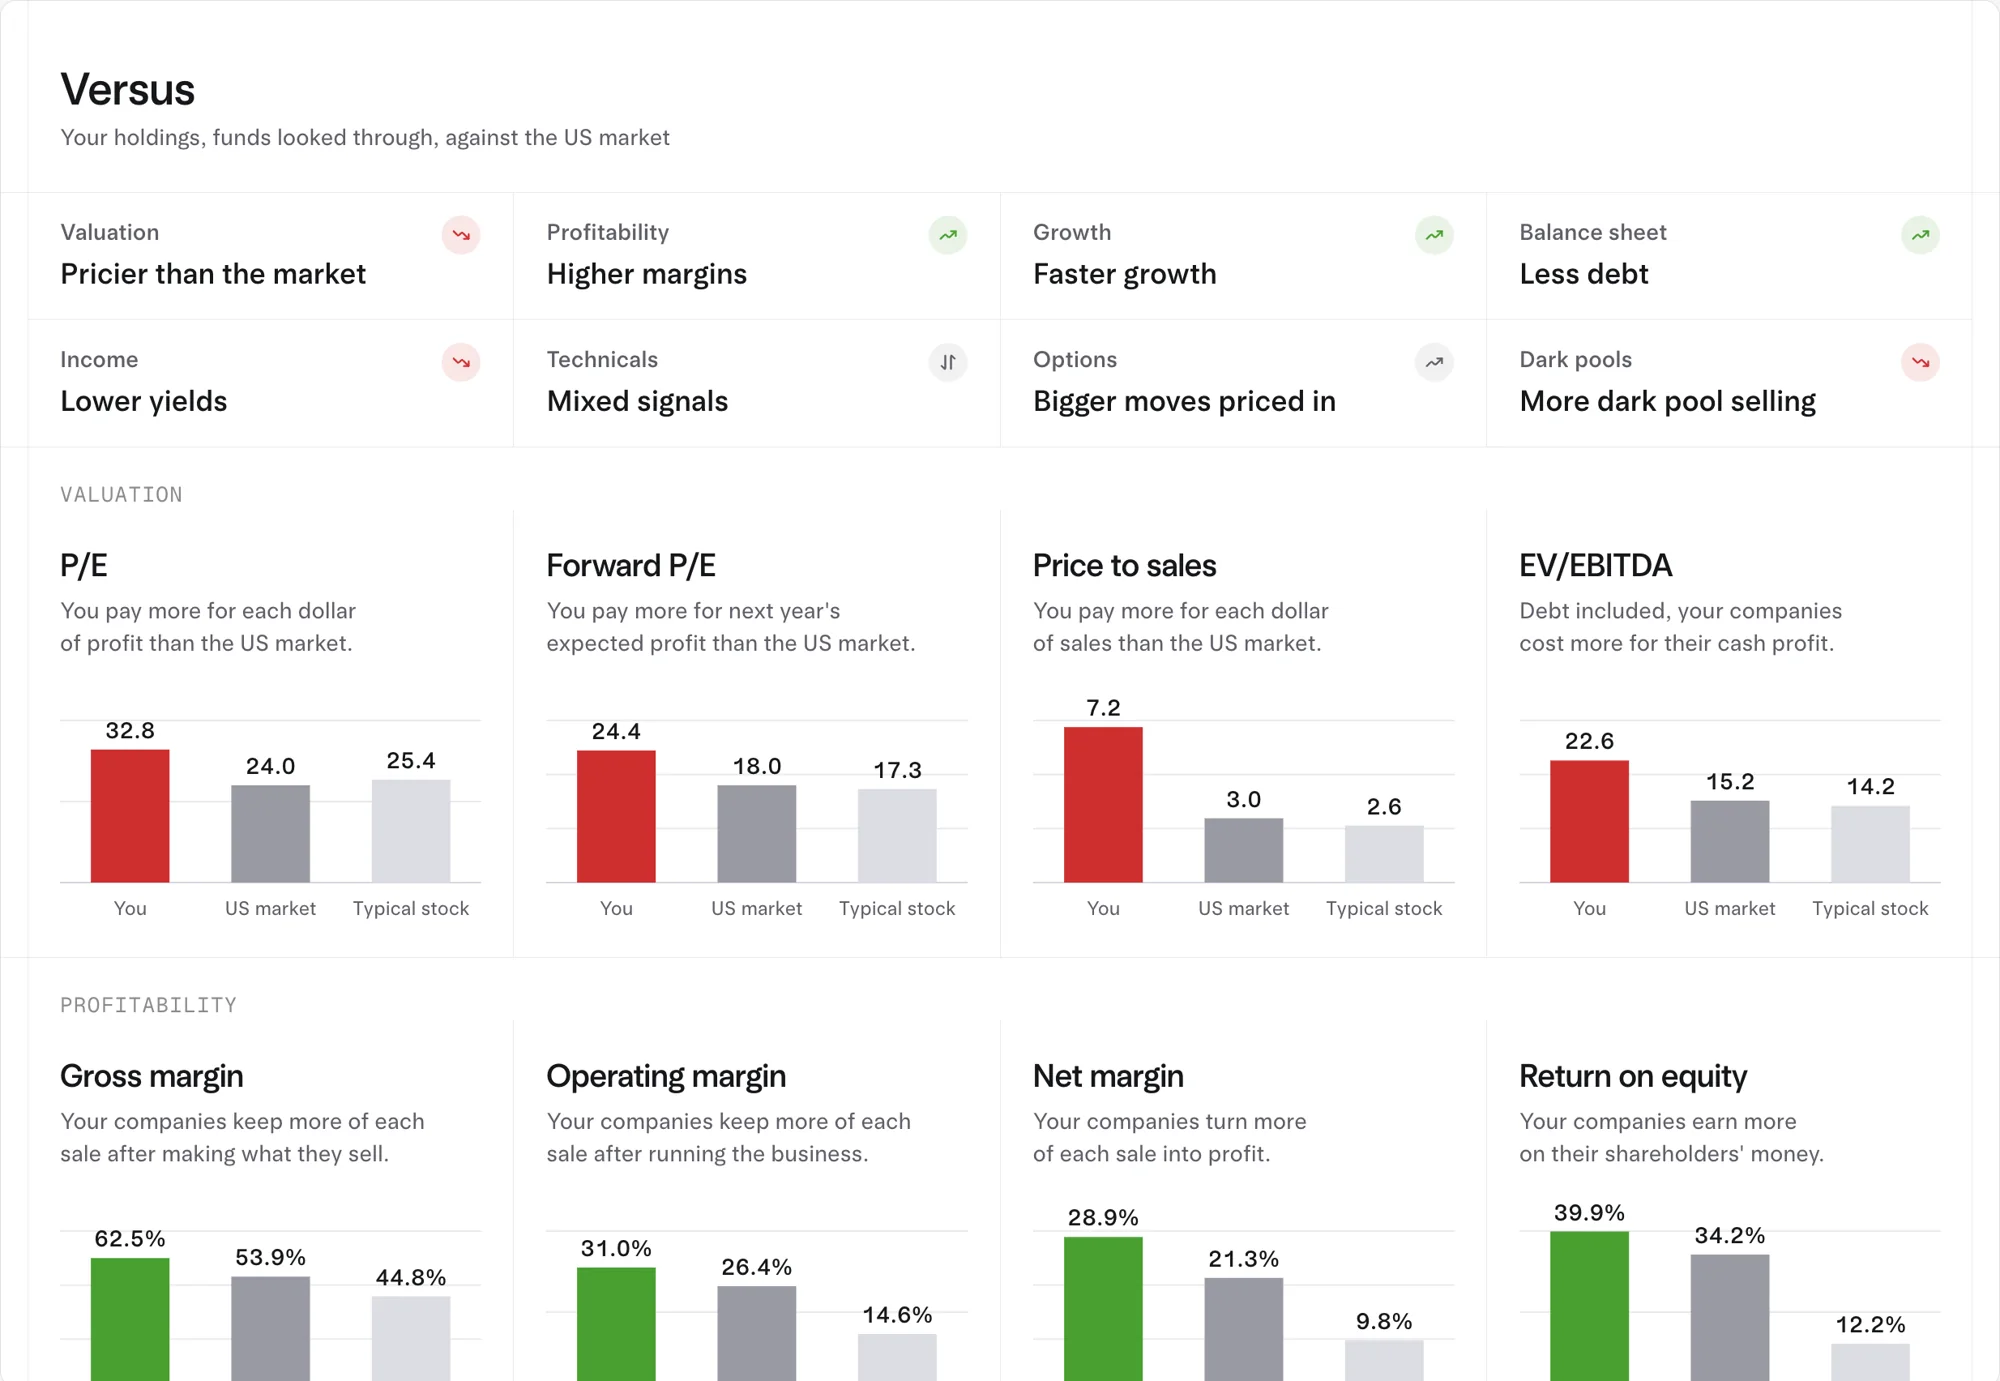
The top of the page is eight tiles, one per group, each with a short verdict and an arrow: green when the difference is good for you, red when it isn't, grey when it's neither. Below them, every metric gets its own card with a one-line reading ("You pay more for each dollar of profit than the US market") and three bars:
- You: your portfolio's weighted average, so bigger positions count more. Your bar is green when it's better for you than the market's, red when worse, and blue on metrics where higher isn't simply better or worse, such as daily swing.
- US market: the average across US stocks weighted by company size, so the giants count most. This is close to what an index fund gives you.
- Typical stock: the middle US stock. When it sits far from the US market bar, the biggest companies are pulling the average.
What do the 28 metrics mean?
| Group | Metrics | In plain words |
|---|---|---|
| Valuation | P/E, forward P/E, price to sales, EV/EBITDA | How much you pay for each dollar of profit, next year's expected profit, sales, and cash profit with debt included. Higher means pricier. |
| Profitability | Gross margin, operating margin, net margin, return on equity | How much of each sale your companies keep at each step, and how much they earn on shareholders' money. Higher is better. |
| Growth | Sales growth, EPS growth, forward sales growth, forward EPS growth | How fast sales and profits grew over the past year, and how fast analysts expect them to grow next year. |
| Balance sheet | Debt to equity, debt to EBITDA | How much debt your companies carry for what shareholders own, and how fast they could pay it off. Lower is safer. |
| Income | Dividend yield, free cash flow yield | How much your holdings pay in dividends, and how much spare cash they make, for their price. |
| Technicals | 3-month return, from 52-week high, RSI, daily swing | Recent performance, distance from the high, whether buyers or sellers have pushed harder lately, and how much your stocks move day to day. |
| Options | Implied volatility, IV rank, put/call, net options flow | How big a move options traders expect, whether that is high for your stocks, how many puts trade against calls, and which way the options money leans. |
| Dark pools | Dark pool buying, dark pool activity, short volume, short interest | How your stocks' dark pool trades split between buys and sells, how busy they are, and how much short selling there is. |
The SEC's Beginners' Guide to Financial Statements gives the formulas for P/E, operating margin and debt to equity. For the options group, implied volatility is the market's estimate of how much a stock will move, read from option prices; see what implied volatility is, IV rank vs IV percentile and the put/call ratio.
What does "funds looked through" mean?
An ETF is a basket of stocks, so Versus counts it as the stocks inside it. If you hold QQQ, its holdings feed the averages in proportion to your position, instead of QQQ counting as one mystery line. That matters because many portfolios that look diversified are mostly the same big companies held through several funds. Looking through shows what you really own.
How do you read Versus? A short routine
- Read the eight tiles first. They are the summary. Note which are green and which are red.
- Pair valuation with growth. "Pricier than the market" is fine when growth and margins are higher too; you are paying for something. Pricier with slower growth is the combination to question.
- Check the balance sheet and income. Heavy debt and a thin free cash flow yield together make a portfolio fragile when rates or earnings disappoint.
- Look at daily swing. A daily swing above the market's means days like October 30, 2026 hit harder: the S&P 500 fell 1.59% that day, but AMD fell 10.28% and the AI chip group 9.29%. If your bar is well above the market's, size your positions for that.
- Read options and dark pools last. They describe what traders are doing in your stocks now: expected moves, put demand, net options flow and dark pool selling. Use them as context, then dig into a single name on its research page.
- Switch to Factors. Versus shows what you own; Factors shows how your returns behaved, including whether you beat the market or just rode it.
Which plans include Versus?
| Free | Live | Pro | |
|---|---|---|---|
| Price | $0 | $39 a month or $299 a year | $69 a month or $499 a year |
| Broker link and portfolio tracker | Yes | Yes | Yes |
| Versus and Factors | No | Yes | Yes |
Common questions
What is the difference between Versus and Factors?
Versus compares what you own with the market: valuation, margins, growth, debt, dividends, technicals, options and dark pools. Factors looks at your returns: how much came from the market, sectors, styles and stock selection.
Does Versus include my ETFs?
Yes. ETFs are looked through to the stocks inside them, weighted by your position.
Is "Pricier than the market" a bad sign?
Not on its own. Read it next to growth and profitability. Higher valuation with faster growth and higher margins is a choice; higher valuation without them is a risk worth knowing about.
Why compare with both the US market and a typical stock?
The US market is weighted toward the biggest companies, so it's close to an index fund. The typical stock is the middle company. Seeing both tells you whether you differ from the index or from the average business.
Which plan do I need for Versus?
Live ($39 a month) or Pro ($69 a month). The portfolio tracker is free on every plan.
Sources
- SEC: Beginners' Guide to Financial Statements, which explains the income statement and balance sheet and ratios such as P/E, operating margin and debt to equity.
- Options Industry Council: Volatility & the Greeks, defining implied volatility as how much the market expects a price to move, based on option prices.