Is your portfolio beating the market or just riding it? Tradytics factors explained
By Faizan Ahmad. Updated .
Read two numbers together. Excess return is your return minus the S&P 500's over the same period: above zero, you beat the market. Market sensitivity is how much your portfolio moves when the S&P 500 moves 1%: well above 1, part of any lead in a rising market is just extra market exposure. Tradytics shows both on the Factors page (tradytics.com/portfolio/factors, Live and Pro), then splits your return into the market, sectors, styles, options and stock selection, so you can see how much came from your picks.
What does the Tradytics Factors page show?
Factors reads the real trades from your linked portfolio through an in-house factor model built from the market, 11 sectors and 20 styles. Pick a window at the top right: 1M, 3M, 6M or 1Y.
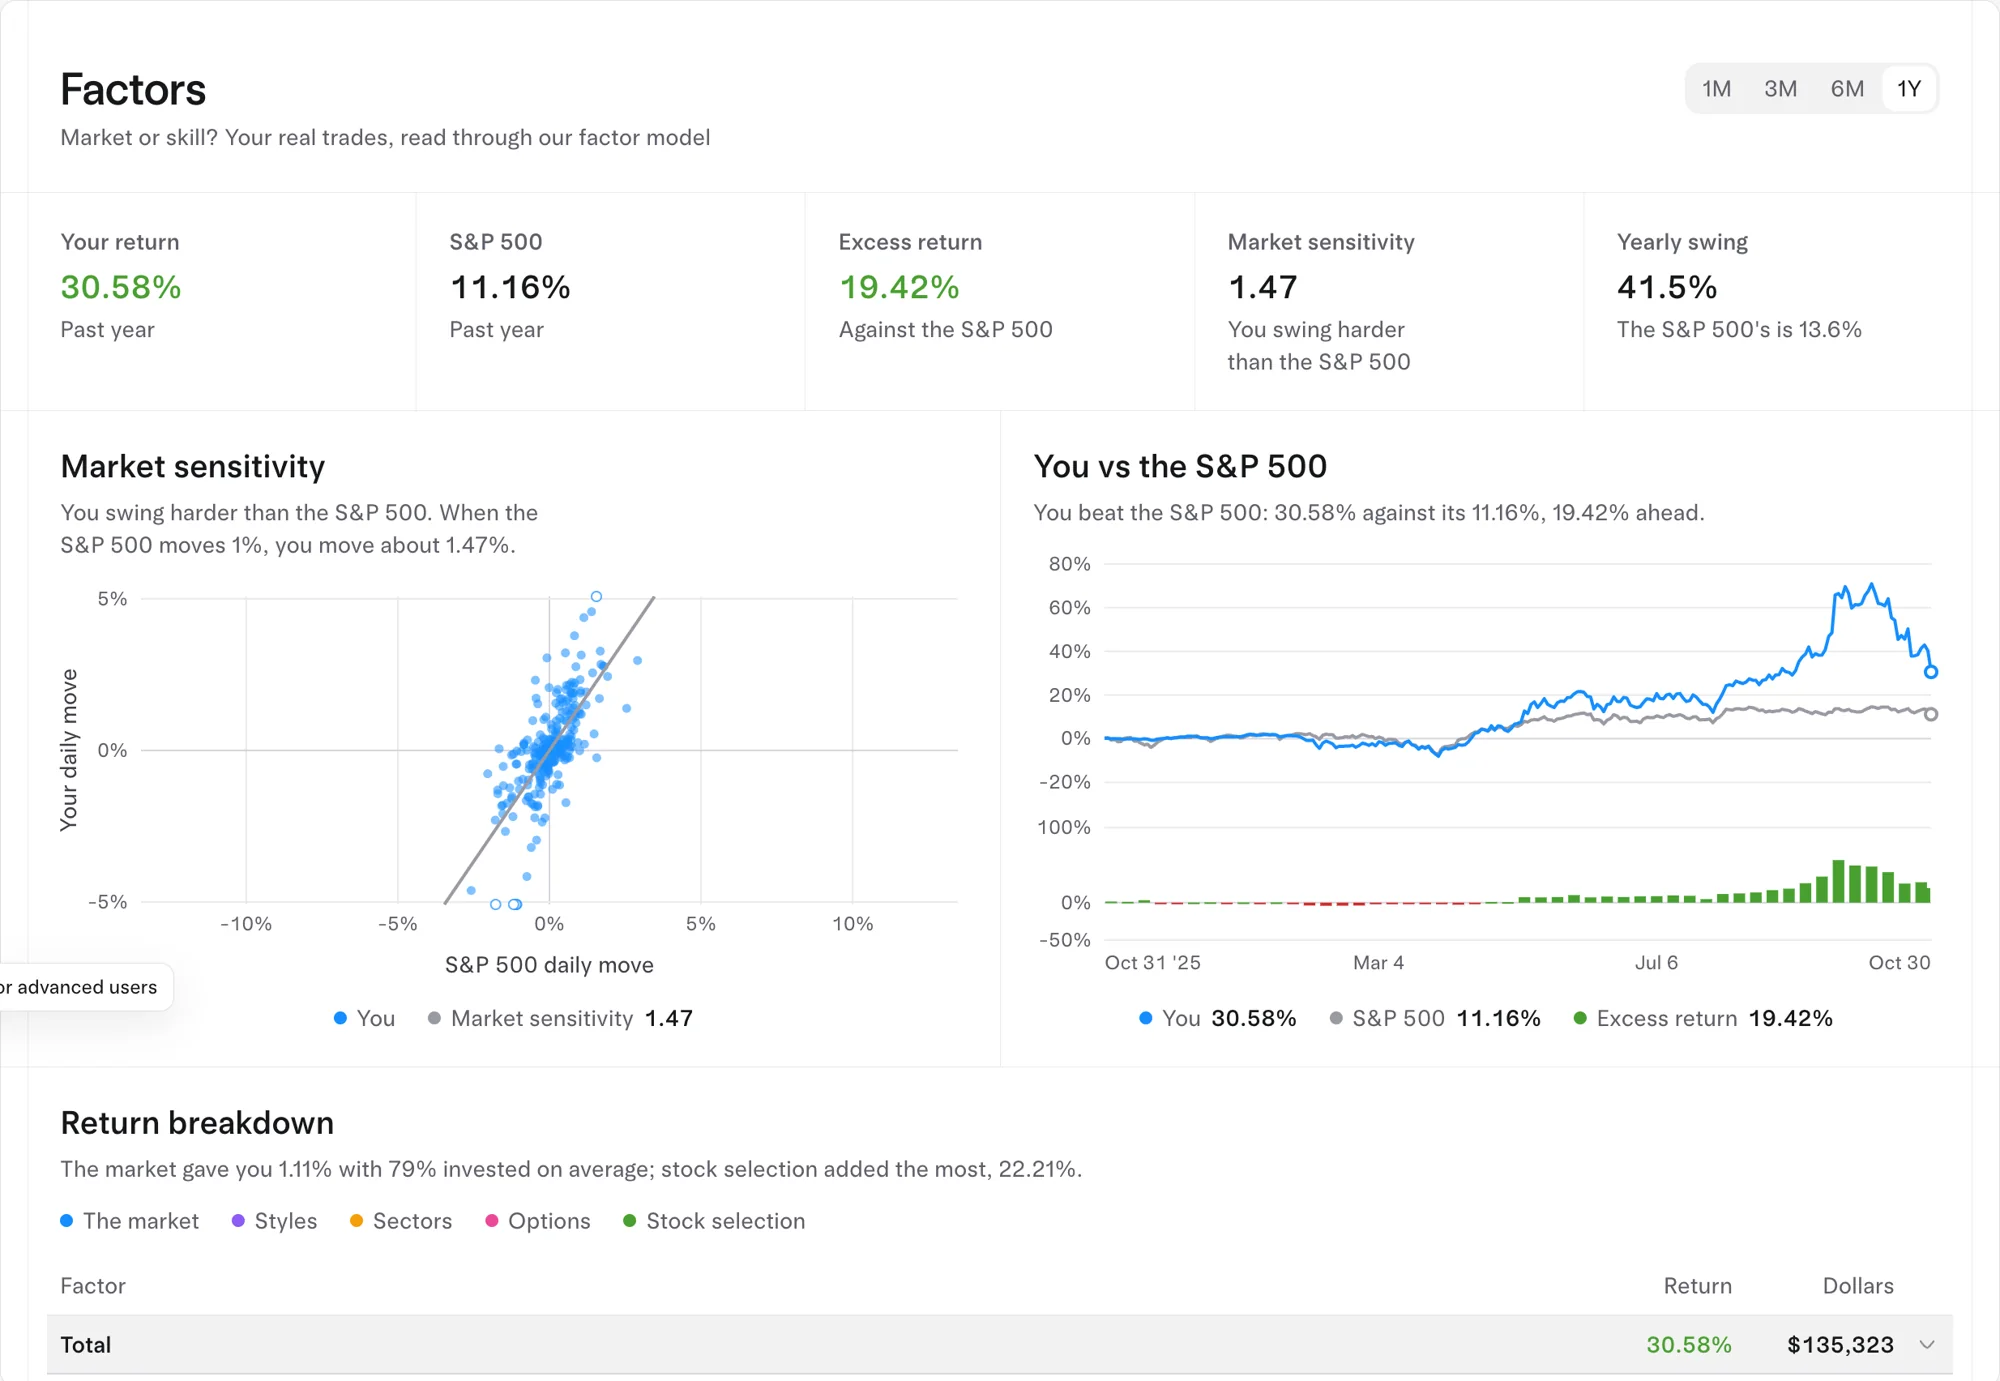
- Top row: Your return, the S&P 500's return, Excess return, Market sensitivity and Yearly swing, each with a plain line under it.
- Market sensitivity chart: every day as a dot, your move against the S&P 500's, with a line whose slope is your sensitivity.
- You vs the S&P 500: both returns as lines, with bars underneath for the gap between them (green when you're ahead, red when behind).
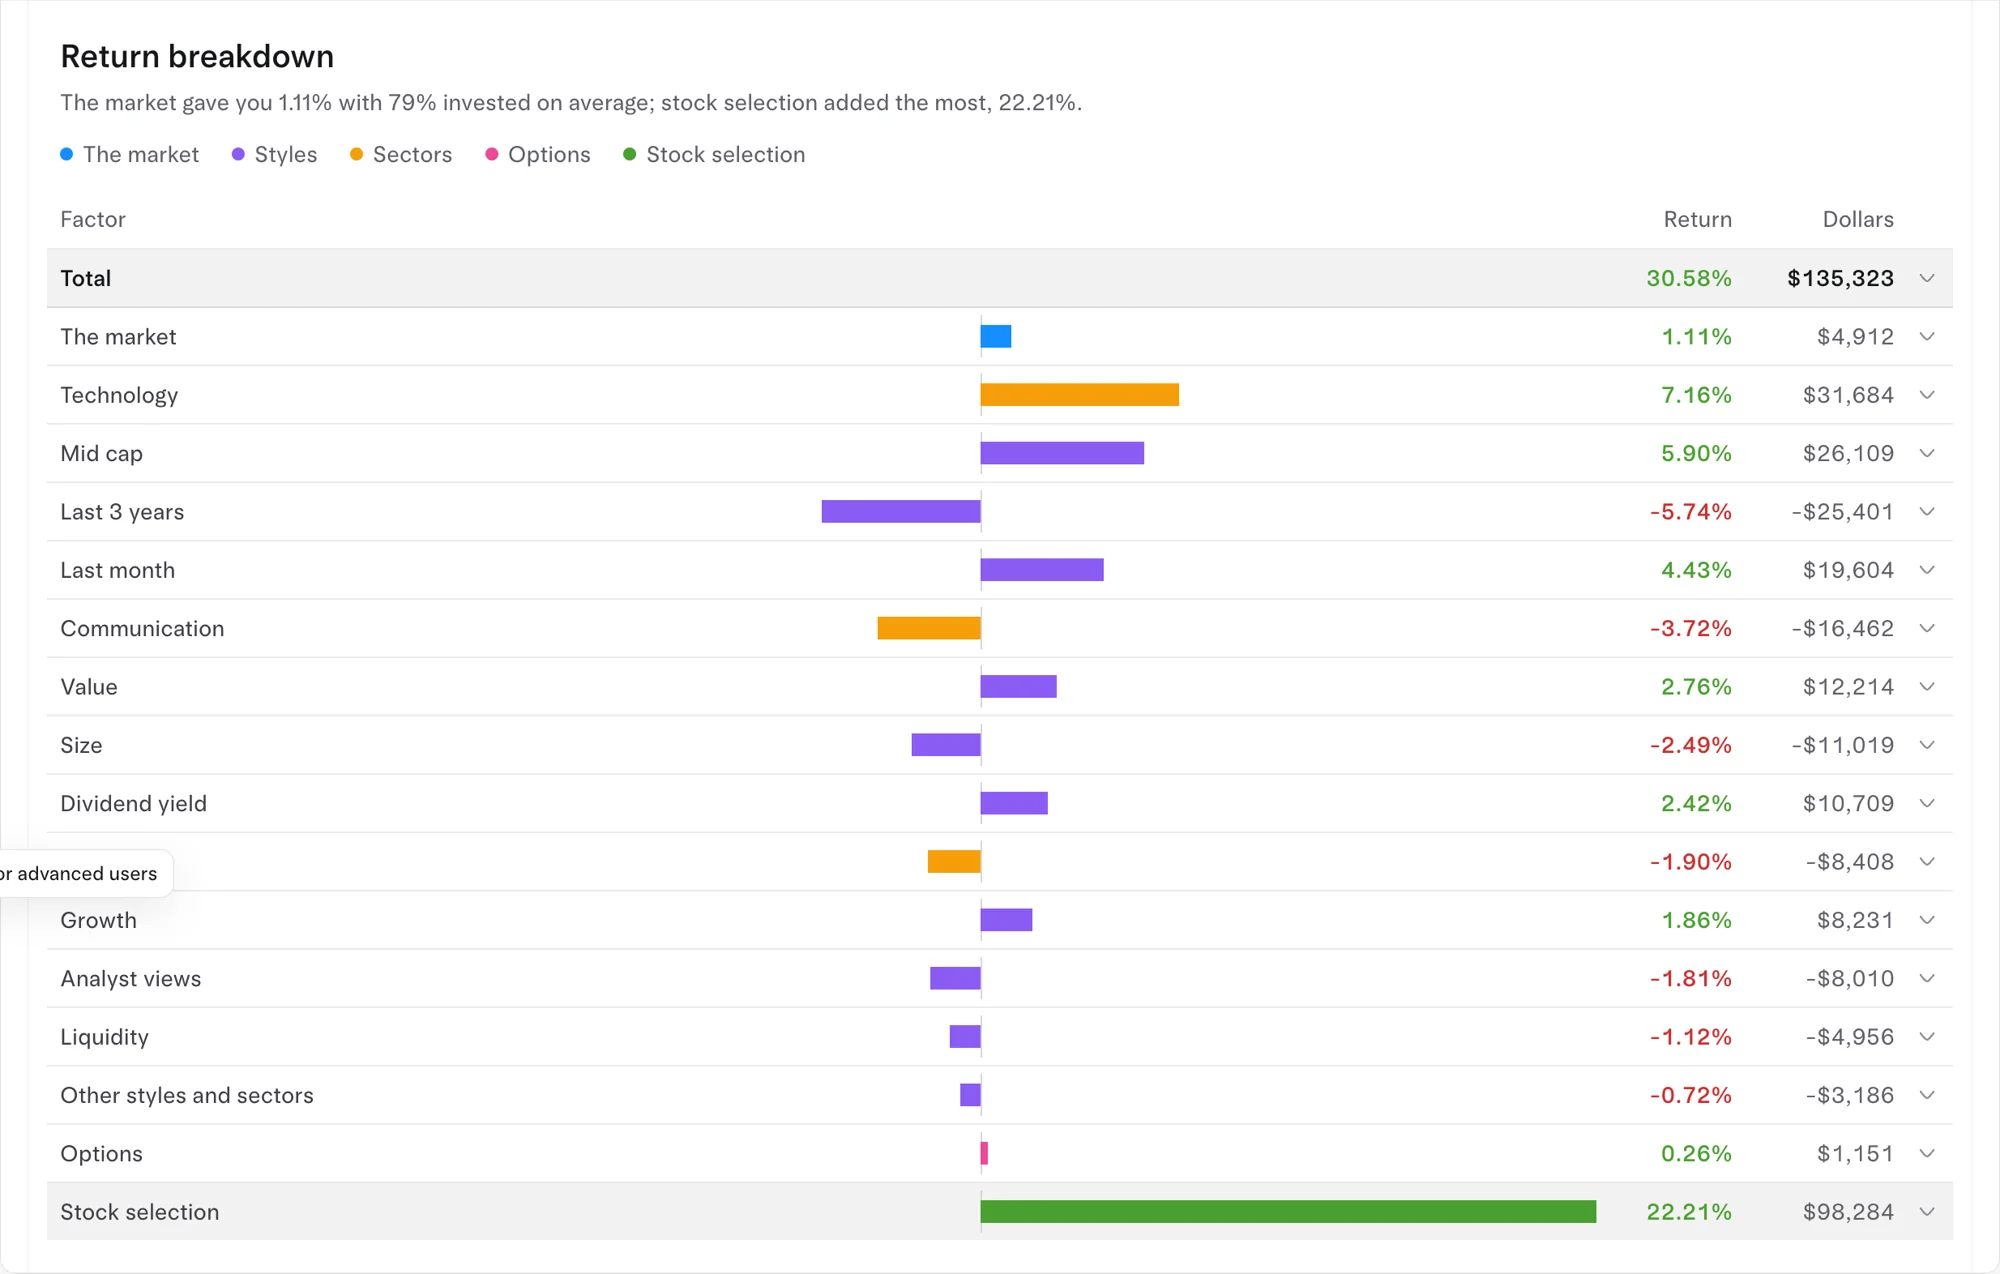
- Return breakdown: your return split by factor, in percent and dollars, with the holdings behind each part.
- Style leans, sector bets and style leans by holding: how your portfolio tilts compared with the S&P 500, and which stocks cause it.
- Risk breakdown, stress test and position risk: where your swings come from and how today's portfolio would have done in six past crashes.
What is market sensitivity?
Market sensitivity answers one question: when the S&P 500 moves 1%, how much do you move? At 1.0 you move with the market. At 1.5 you move about 1.5%, up and down. At 0.5 you move about half as much. Finance textbooks call this beta, and FINRA describes it the same way: the benchmark has a beta of 1, and a stock with a beta of 1.2 has historically moved 120% of the index's move.
A real day makes it concrete. On October 30, 2026, the S&P 500 fell 1.59%. A portfolio with a market sensitivity of 1.47, like the sample portfolio in the screenshot, would be expected to lose about 2.3% that day from the market alone (1.47 x 1.59%). A portfolio at 0.8 would be expected to lose about 1.3%. Anything beyond that came from what you own, not from the market.
On the chart, a tight cloud of dots along the line means the market drives most of your days. Dots far from the line are days your holdings did their own thing.
What is excess return?
Excess return is the simplest scorecard: your return minus the S&P 500's over the same window. In the sample portfolio, a 30.58% return against the S&P 500's 11.16% gives an excess return of 19.42%. The green and red bars under the You vs the S&P 500 chart show how that gap built up over the year, so you can see whether it came steadily or in one burst.
Beating the market or riding it: how do you tell?
Excess return says whether you won. Market sensitivity says how hard you leaned on the market to do it. A quick check: multiply your market sensitivity by the S&P 500's return. That is roughly what riding the market at your level would have paid. If your return is close to that number, you mostly rode it. If it's well above, something else worked.
The return breakdown does this properly, for every factor at once.
| Part | What it means |
|---|---|
| The market | What simply being invested in stocks paid you |
| Sectors | What your sector bets added or cost, such as being heavy in technology |
| Styles | What your tilts added or cost: size, value, growth, momentum, dividend yield and more |
| Options | What your options positions added or cost |
| Stock selection | What's left once all of the above is taken out: the return from which stocks you picked |
Stock selection is the closest thing to skill on the page, but check it before you celebrate. Open the row to see the holdings behind it. If one stock made nearly all of it, that is one great pick, not a repeatable edge yet. A short window can flatter you too, so compare 1Y with 3M and 6M.
What do yearly swing, style leans and sector bets mean?
- Yearly swing is how bumpy your returns are over a year, shown next to the S&P 500's. FINRA's rule of thumb applies: the more dramatic the swings, the higher the risk. Note that market sensitivity and swing are different things; a portfolio can swing hard on moves that have nothing to do with the market.
- Style leans show how far you tilt toward each style, where the S&P 500 sits at 0. The legend grades each lean: minimal under 0.5, moderate 0.5 to 1, strong 1 to 2, extreme over 2.
- Sector bets list each sector's share of your portfolio, the S&P 500's share, and the gap.
- Style leans by holding shows which stocks create each tilt, so you know what to trim if a lean is bigger than you want.
How would my portfolio do in a crash?
The stress test runs today's portfolio through six past crashes: the 2008 financial crisis, the 2022 rate hikes, the Covid crash, the late 2018 sell-off, the 2011 euro debt scare and the February 2018 sell-off. Each row puts your loss beside the S&P 500's.
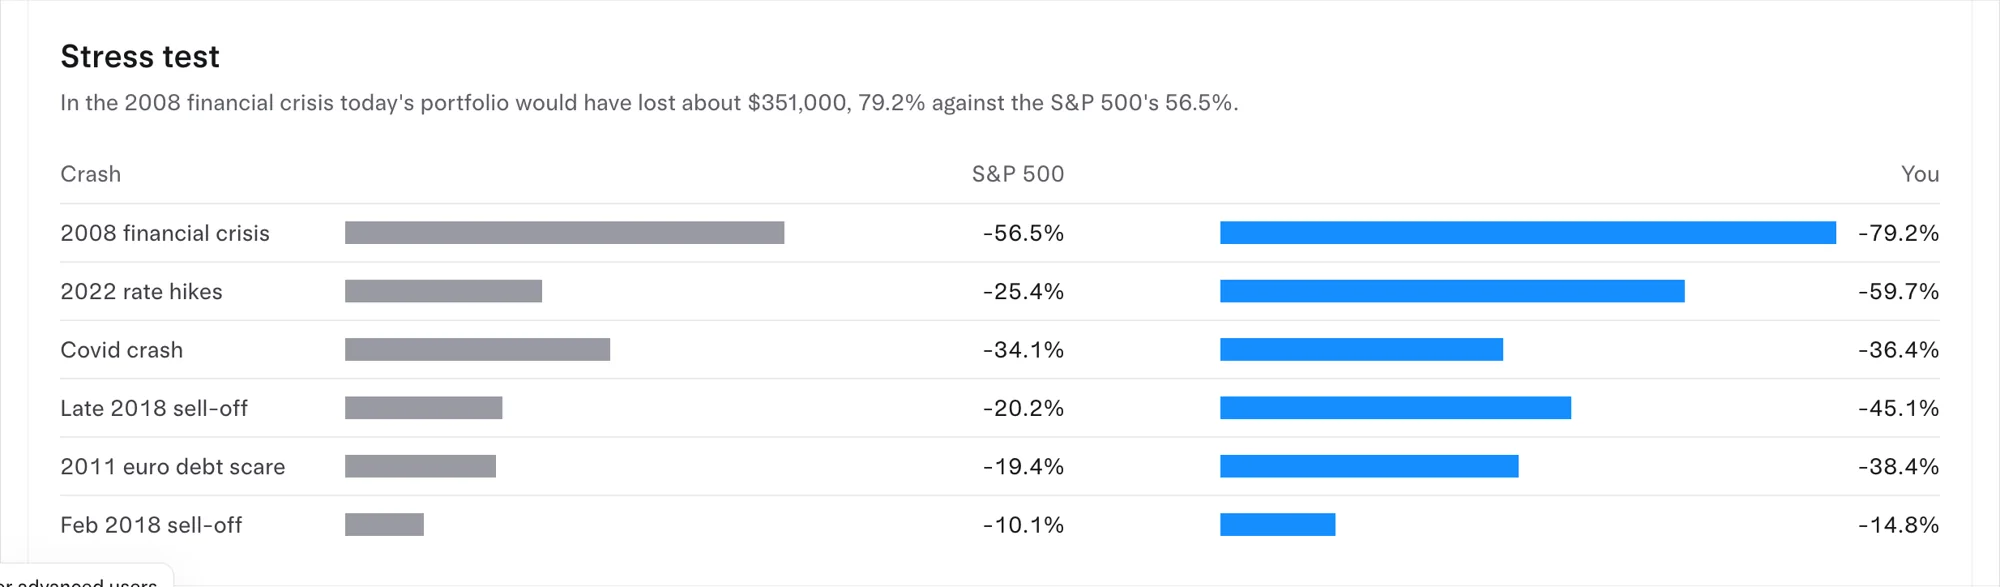
If your bars are far longer than the market's, your high market sensitivity and your tilts work against you on the way down too. The risk breakdown and position risk sections then show which factors and which positions drive those swings.
A monthly factors routine
- Set the window to 1Y and read excess return and market sensitivity together.
- Do the quick check: market sensitivity times the S&P 500's return. Is your return well above it?
- Open stock selection in the return breakdown. Is it many holdings or one?
- Check style leans and sector bets for anything strong or extreme you didn't choose on purpose.
- Look at the stress test. Could you sit through your worst row?
- Switch to Versus to see what you own compared with the market: valuation, growth, debt, options and dark pool activity.
Which plans include Factors?
| Free | Live | Pro | |
|---|---|---|---|
| Price | $0 | $39 a month or $299 a year | $69 a month or $499 a year |
| Portfolio tracker | Yes | Yes | Yes |
| Factors and Versus | No | Yes | Yes |
Yearly plans come to 4 months free. See Tradytics pricing for everything else each plan includes.
Common questions
Is market sensitivity the same as beta?
Yes. It is how much your portfolio moves when the S&P 500 moves 1%, which is what finance calls beta. Tradytics uses the plain name.
Does a high excess return mean I'm a skilled trader?
Not by itself. With a market sensitivity well above 1 in a rising market, part of the lead is extra market exposure. Stock selection in the return breakdown, spread over many holdings and more than one window, is the better sign.
What is in the Tradytics factor model?
It is built in-house from the market, 11 sectors and 20 styles, and it reads your real trades from your linked brokerage.
Why can't I see Factors on the Free plan?
Factors and Versus are part of Live and Pro. The portfolio tracker itself, with holdings, round trips and P&L, is free on every plan.
Sources
- FINRA: Volatility, on beta (a benchmark beta of 1, how a stock moves relative to the market) and what volatility means for risk.
- Kenneth R. French Data Library, the standard public source for factor returns such as market, size, value and momentum.