What is implied volatility?
By Faizan Ahmad. Updated .
Implied volatility (IV) is the size of move the options market is pricing into a stock, written as a yearly percentage and worked backward from option prices. An IV of 40% means options are priced as if the stock's typical one-year move, one standard deviation, is about 40% in either direction. Higher IV means more expensive options and a bigger expected move. It says nothing about which way the stock will go.
How is implied volatility calculated?
Nobody sets IV. It is solved for. Take a pricing model, feed it everything that is known (stock price, strike, days to expiry, interest rates, dividends), then find the one volatility number that makes the model's price match the option's market price. Cboe's published methodology does exactly this: a binomial model for American-style options and Black-Scholes for European-style options, adjusted until the model price equals the observed price.
Two things follow. IV moves whenever option prices move, so it is a live read of supply and demand for options. And every strike and every expiry has its own IV, because each has its own price.
How do you turn IV into an expected move?
Scale the yearly number down to the time you care about:
expected move ≈ stock price × IV × √(days ÷ 365)
On October 30, 2026, SPY closed at $757.12, and its options expiring Monday, November 2 were priced at 12.4% IV. Counting 2 days to that expiry, as Tradytics' expected-move card does: $757.12 × 0.124 × √(2 ÷ 365) ≈ $6.95. Tradytics showed ±$6.93, the small gap being rounding in the IV. For Nvidia, $205.25 × 0.314 × √(2 ÷ 365) ≈ $4.77, exactly the ±$4.77 shown for its November 2 options at 31.4% IV.
Under the model's assumptions, the stock finishes inside that range about two times in three. The full method, and how traders use it, is in what is the expected move.
Implied vs historical volatility: what's the difference?
| Implied volatility | Historical (realized) volatility | |
|---|---|---|
| Looks | Forward | Backward |
| Comes from | Option prices | The stock's past daily moves |
| Changes | Every time option prices change | When new closing prices come in |
| Tells you | How expensive options are and what move they price | How much the stock has actually been moving |
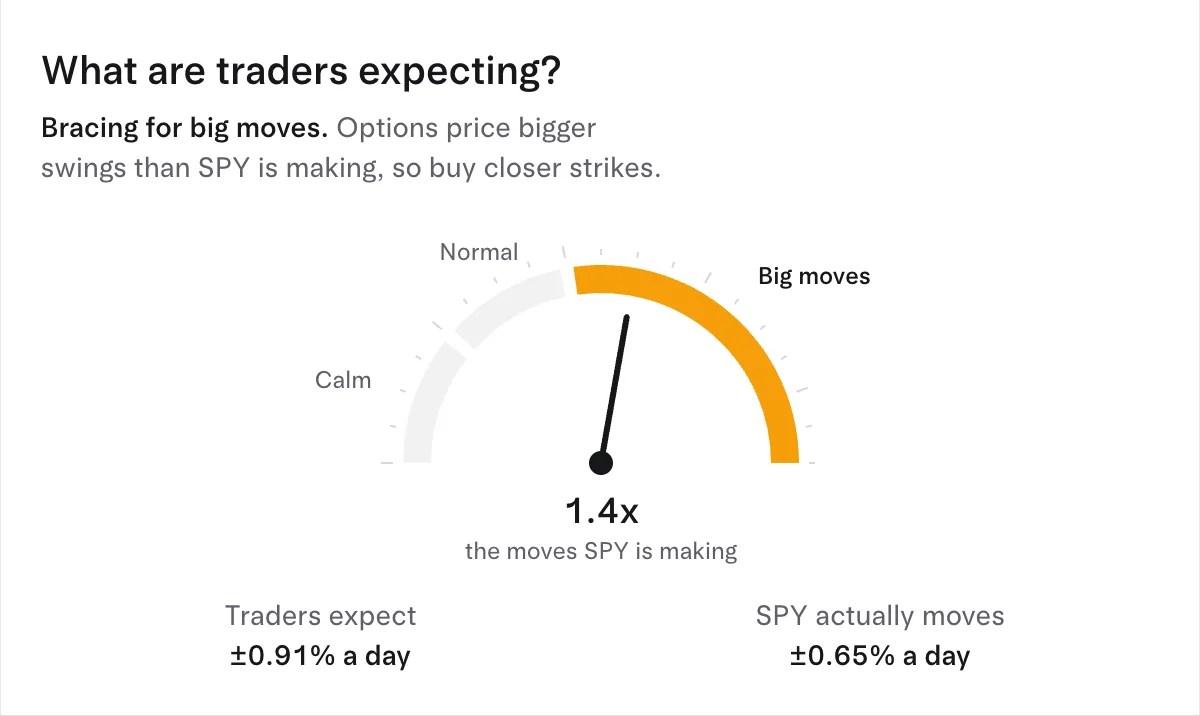
The gap between the two is where option traders look for value. When IV sits well above the moves a stock is actually making, options are pricing more fear than the tape shows; when it sits below, options are cheap for the moves happening.
Why does implied volatility change?
- Selloffs. IV usually rises when stocks drop. On October 30, 2026, the S&P 500 fell 1.59% and Tradytics showed IV rising 5.9 points for Nvidia to 45.7%, 6.6 for AMD to 74.3% and 6.1 for Tesla to 49.0%.
- Scheduled events. IV climbs into earnings and drops once the news is out. Apple's IV was up 12.3 points to 42.4% ahead of its Monday report, while Amazon's fell 27.3 points to 39.5% the same day. That collapse has a name: IV crush. It's also why call buying before earnings is harder to profit from than it looks.
- Stock-specific risk. The highest IVs that day were TDOC at 389%, SLS at 258% and VFC at 167%. Readings like that usually mean a pending event or a very jumpy stock, and options priced for enormous moves.
Why does each expiry and strike have a different IV?
Lay IV out by expiry and you get the term structure; lay it out by strike and you get the smile (or skew). Cboe compares the term structure to the yield curve in bonds: a curve of what the market expects over different horizons. On October 30, 2026, Tradytics showed NVDA's IV at 45.7%, while its options expiring Monday, November 2 were priced at 31.4%. A bump at one expiry usually marks an event the market expects, such as an earnings date, and that expiry carries the extra premium.
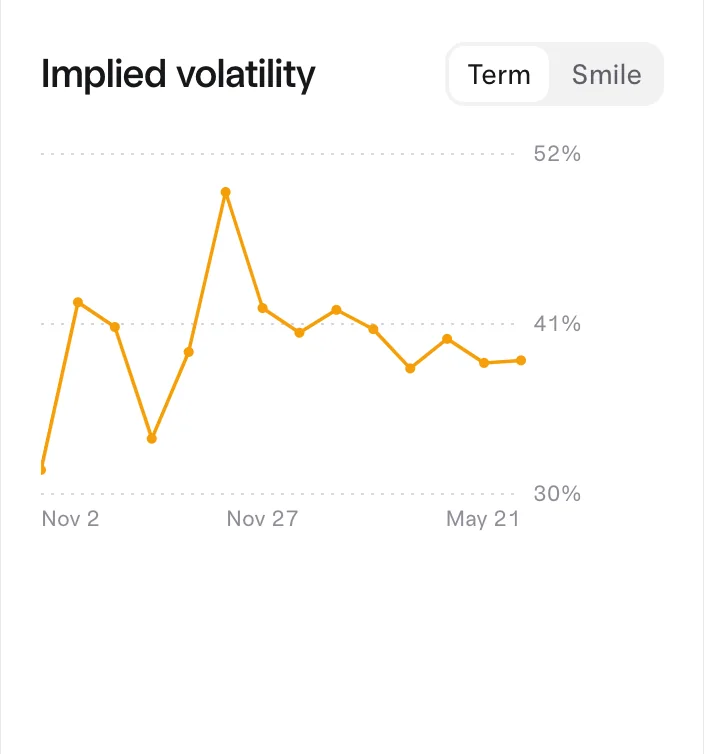
Raw IV only compares a stock with itself. Whether 45.7% is high for Nvidia depends on Nvidia's own history, which is what IV rank and IV percentile measure. How much your option gains or loses when IV moves is vega.
How to see it on Tradytics
Each stock's research options page, such as NVDA options, shows implied volatility as a term curve and a smile, plus the expected move by expiry. The options market page has the "What are traders expecting?" and "Calm day or wild day?" cards, which compare what SPY options price with what SPY actually does. On the live options flow page, every large print shows the IV it traded at.
Common questions
Does high implied volatility mean the stock will fall?
No. IV measures the size of the expected move, not its direction. It often rises in selloffs, but it also rises before earnings and other big events.
Is implied volatility the same as the VIX?
The VIX applies the same idea to the whole S&P 500: Cboe describes it as the market's expectation of near-term volatility, taken from S&P 500 index option prices. A single stock's IV comes from that stock's options.
Is high IV good for buyers or sellers?
High IV makes options expensive for buyers, who then need a bigger move to profit. Sellers collect more premium but are taking the other side of the very move the market fears.
What is a normal IV?
There's no universal number. On October 30, 2026, SPY's November 2 options were at 12.4% while Microsoft's IV reading was 37.3% and AMD's 74.3%. Compare a stock with its own past, not with other stocks.
Sources
- Cboe Global Indices, American and European-Style Theoretical Options Calculation Methodology: implied volatility solved by matching model prices (binomial or Black-Scholes) to observed option prices.
- Cboe, VIX Volatility Products: the VIX as the market's expectation of near-term volatility from S&P 500 option prices.
- Cboe, VIX Term Structure: the implied volatility term structure compared with the interest rate term structure.
- OCC and the US options exchanges, Characteristics and Risks of Standardized Options (June 2024): market participants' estimates of future volatility as a driver of option premiums.
- SPY options traded $332.54M in premium on 2026-11-02: $193.21M in calls and $139.32M in puts, a net bullish lean of $32.03M.
- Put/call ratio 0.72.
- Options price a move of about ±$6.07 by 2026-11-02.
- Max pain for 2026-11-02 is $765.0.
Updated 2026-11-02 16:02 UTC