What is the expected move, and how is it calculated?
By Faizan Ahmad. Updated .
The expected move is the up-or-down range options are pricing for a stock by a given expiration, usually one standard deviation, which would mean about a 68% chance of finishing inside if moves were normally distributed. It's calculated as price × implied volatility × √(days to expiration ÷ 365), or read roughly from the price of the at-the-money straddle. On October 30, 2026, SPY closed at $757.12 with 12.4% implied volatility to the November 2 expiry, for an expected move of about ±$6.93: a range of $750.19 to $764.05.
How is the expected move calculated?
Expected move = price × implied volatility × √(days to expiration ÷ 365)
Implied volatility is quoted per year, so the square root scales it down to the time left. Working SPY through it with 2 days counted to the November 2 expiry: $757.12 × 0.124 × √(2 ÷ 365) ≈ $6.95. Tradytics shows ±$6.93, the same to within a couple of cents once you allow for rounding in the 12.4%. That's about 0.92% either way.
The same math shows what earnings do. Apple reports Monday, and its options to the November 4 expiry carried 45.7% implied volatility: $345.10 × 0.457 × √(4 ÷ 365) ≈ $16.5, which matches the ±$16.49 shown. That's a range of $328.61 to $361.59, about 4.8% either way, roughly three times SPY's ±$12.31 (1.6%) to the same November 4 expiry. As Cboe puts it in its earnings guide, the market prices in an expected move around the report.
The straddle shortcut
An at-the-money straddle (buying the call and the put at the strike nearest the price) costs roughly what the market expects the average move to be. Because the average size of a move is about 0.8 of one standard deviation, the straddle price comes out a little smaller than the formula's number.
| Method | How | What you get | Watch out for |
|---|---|---|---|
| Implied volatility formula | Price × IV × √(days ÷ 365) | One standard deviation, about a 68% range if moves were normal | Which IV is used and how days are counted |
| At-the-money straddle | Call price plus put price at the nearest strike | The expected average move, about 0.8 of one standard deviation | Wide quotes and strikes that aren't exactly at the money |
Both are fine. Just don't compare a straddle-based number from one site with a formula-based number from another and conclude something changed.
How does the expected move grow with time?
| SPY expiry | Days counted | Implied volatility | Expected move |
|---|---|---|---|
| November 2, 2026 | 2 | 12.4% | ±$6.93 |
| November 3, 2026 | 3 | 14.6% | ±$9.99 |
| November 4, 2026 | 4 | 15.5% | ±$12.31 |
| November 5, 2026 | 5 | 16.9% | ±$14.97 |
| November 6, 2026 | 6 | 16.9% | ±$16.44 |
| November 9, 2026 | 9 | 16.0% | ±$19.01 |
| November 10, 2026 | 10 | 15.8% | ±$19.76 |
With flat volatility, the move grows with the square root of time, so 10 days would be about 2.2 times the 2-day move. Here it's 2.85 times, because implied volatility for the later expiries is higher. Part of that is the calendar: the 2-day window spans a weekend with no trading. Part is the market pricing a busier stretch after Monday. When one expiry's volatility jumps above its neighbors, the market is pricing something specific in that window.
What is the expected move good for?
- Judging strikes. If the range really held 68% of outcomes, a stock would finish beyond either edge about one time in six. A call struck above the upper edge needs a bigger-than-priced move to pay at expiration.
- Earnings. Compare the priced move with how far the stock actually moved after past reports, and remember that implied volatility usually drops after the news. See what is IV crush and what big call buying before earnings means.
- Checking levels. SPY's range to November 2 topped out at $764.05, far below its $810 call wall, while its $758 put wall sat inside the range right next to the price. Only one of those levels was in play for that expiry.
- Setting expectations. With SPY priced for ±0.92% to November 2, a 1% drop by Monday would be a bigger move than options expected. For Apple through earnings, 1% would sit well inside its ±4.8%.
Where the expected move misleads
- Big days are more common than the bell curve says. Real returns have fat tails, so the "68%" is an approximation that breaks in selloffs.
- It's about the close at expiration, not the high and low along the way. Price can poke outside the range and come back.
- Implied isn't actual. Options can price more or less movement than the stock delivers. That gap is what option sellers and buyers are really trading.
- The range isn't symmetric in practice. Strikes below the price usually carry higher implied volatility than strikes above it (the skew), so downside moves are priced bigger than a plain ± suggests.
- Platforms count differently. Some count calendar days, some trading days, and Friday's close to Monday's expiry can be counted as one, two or three days.
How to see it on Tradytics
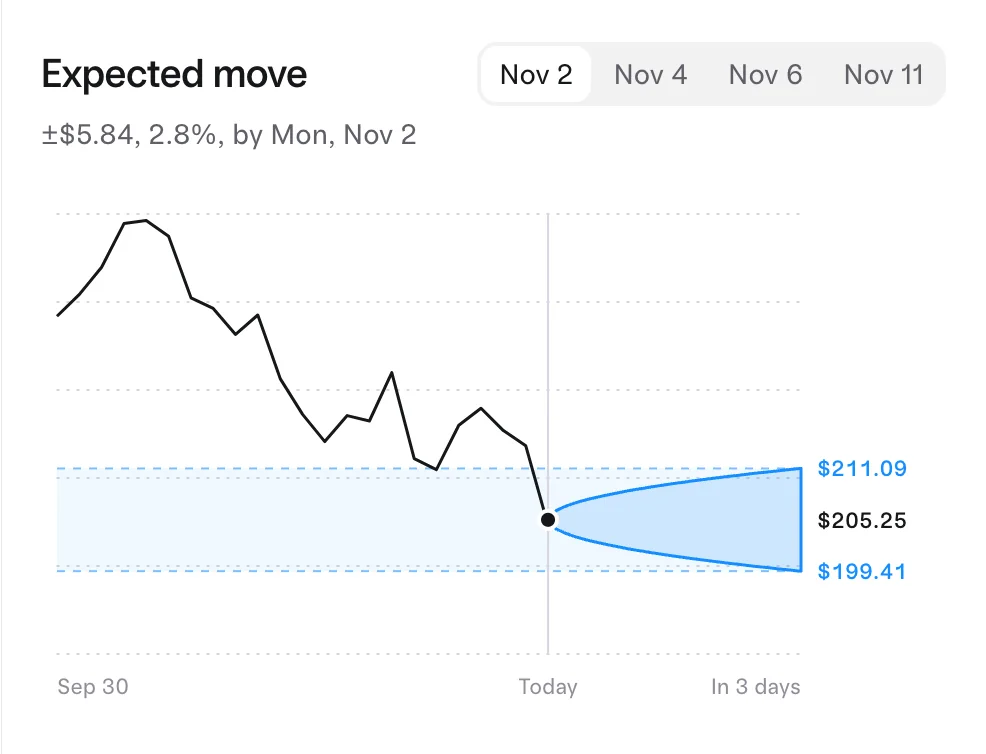
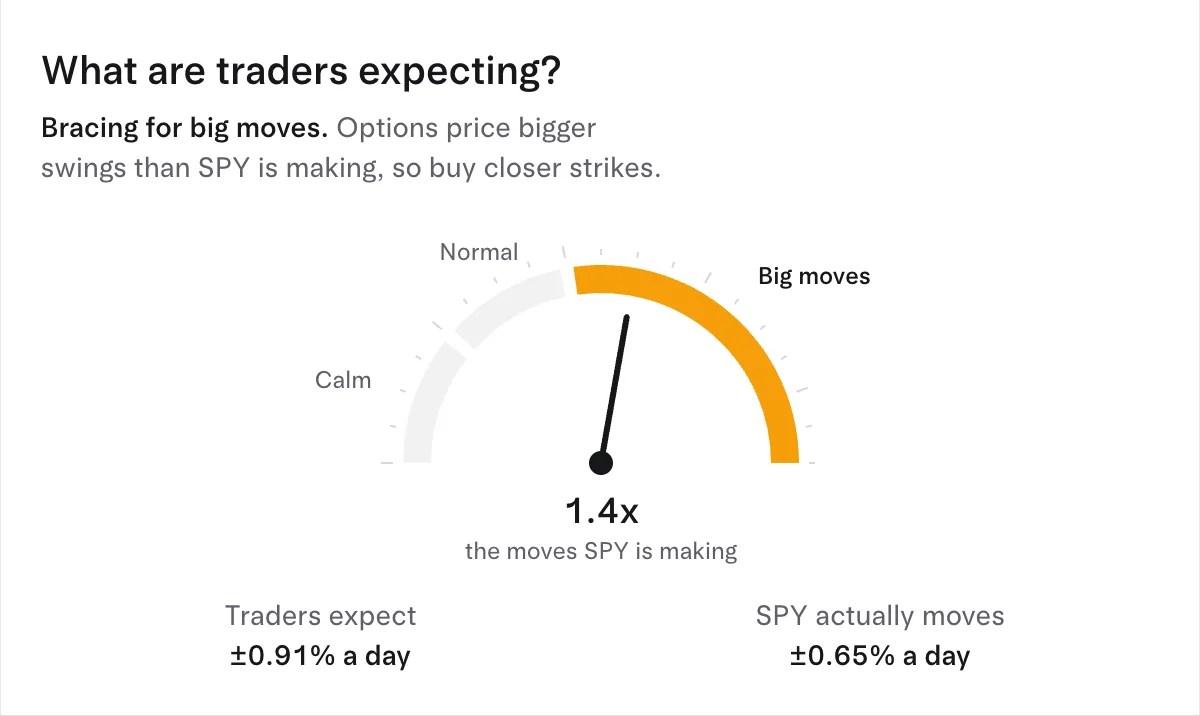
Every options research page, such as SPY options, has an Expected move chart: a cone from today's price out to each expiry, with the dollar and percent move. The options market page adds a card comparing the daily move options price for SPY with the move SPY has actually been making, plus where SPY sits in today's likely range. Or ask the AI analyst (Chat button on any page) "What's Apple's expected move into earnings?"
Common questions
Is the expected move a 68% range?
Only if returns were normally distributed. Treat it as roughly two-in-three odds of finishing inside, with more big misses than that math suggests.
What's the difference between expected move and implied volatility?
Implied volatility is a yearly percentage. The expected move converts it into dollars for a specific expiration.
How do you get a one-day expected move?
Divide the yearly implied volatility by about 16, the square root of the roughly 252 trading days in a year. An implied volatility of 32% works out to about 2% a day.
Why does my broker show a different expected move?
It may use the straddle instead of the formula, a different implied volatility (one strike vs a blend), or a different day count.
Sources
- Cboe, VIX Index: implied volatility from S&P 500 option prices as the market's expectation of near-term volatility.
- Cboe, Why Trade Options Around Earnings Season (October 19, 2026): the market prices in an expected move around earnings; straddles need a move bigger than their cost.
- SPY options traded $333.75M in premium on 2026-11-02: $193.28M in calls and $140.47M in puts, a net bullish lean of $31.85M.
- Put/call ratio 0.73.
- Options price a move of about ±$6.07 by 2026-11-02.
- Max pain for 2026-11-02 is $765.0.
Updated 2026-11-02 16:04 UTC