What are call walls and put walls?
By Faizan Ahmad. Updated .
A call wall is the strike carrying the most positive dealer gamma, usually above the price, where dealer hedging tends to sell into rallies and slow them down. A put wall is the strike carrying the most negative dealer gamma, usually below the price, a level traders watch both as support and as the place where selling can speed up if it breaks. Walls are reference levels, not barriers. On October 30, 2026, SPY's call wall was $810 and its put wall $758; Nvidia's were $212.5 and $185.
How are call walls and put walls found?
Both come from a chart of gamma exposure by strike. Each strike gets a bar for the estimated dealer gamma there, and the walls are the extremes:
- Call wall: the strike with the biggest positive bar. Under the usual assumption that dealers are long calls, this is where call positioning is heaviest.
- Put wall: the strike with the biggest negative bar, where put positioning is heaviest.
Definitions vary. Some tools pick the strike with the most call or put open interest instead of the most gamma; some count calls and puts separately, others use the net gamma at each strike; and each looks at a different window of strikes and expiries. That's why two sites can show different walls for the same stock on the same day. The assumptions underneath are covered in how GEX is calculated.
Why would a wall act as resistance or support?
Call wall as resistance. If dealers are long a lot of gamma at one strike, then as price climbs toward it their hedges get longer and they sell to rebalance. As price slips back, they buy. That two-way hedging tends to hold price near the strike and makes it harder to push through, especially as expiration gets close and gamma at that strike grows.
Put wall as support, with a catch. The support story is weaker. Many put holders take profits as price reaches their strike. When they sell those puts back, dealers no longer need the stock they shorted as a hedge and buy it back, which can steady the price. But the heavy negative gamma also means that if the level breaks, dealer hedging adds to the selling. So a put wall is better read as a line where the market's behavior changes than as a floor.
There is real evidence that big strikes pull on prices near expiration. Ni, Pearson and Poteshman (Journal of Financial Economics, 2005) found that on expiration dates, closing prices of stocks with listed options cluster at strike prices. That supports walls as magnets into expiry. It doesn't make them walls on a random Tuesday.
SPY and Nvidia walls on October 30, 2026
| Close | Call wall | Put wall | Total gamma | |
|---|---|---|---|---|
| SPY | $757.12 | $810 (about 7.0% above) | $758 ($0.88 above) | -$335.55M |
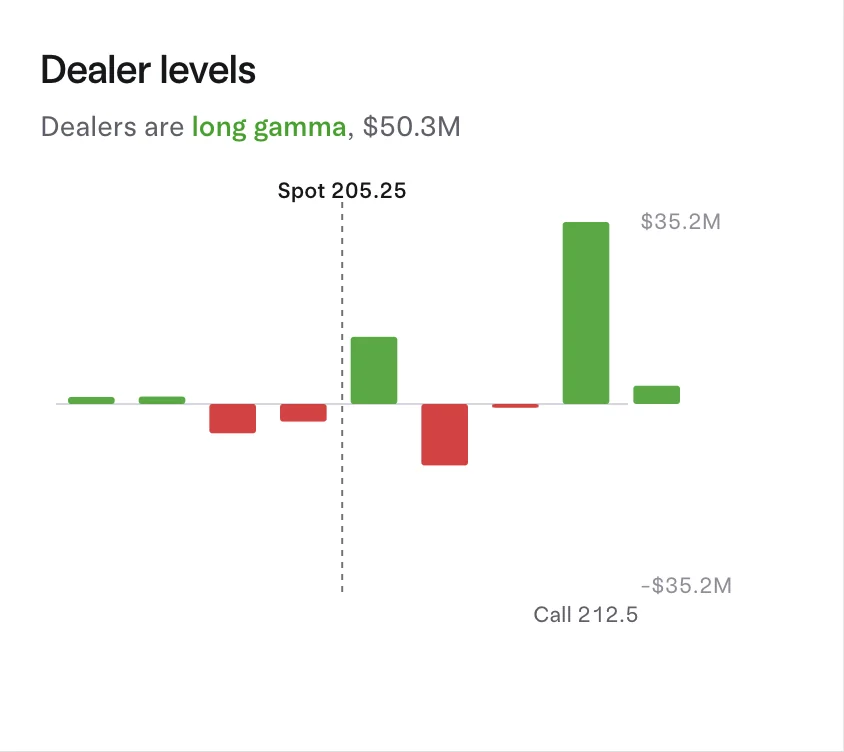
| Nvidia (NVDA) | $205.25 | $212.5 (3.5% above) | $185 (9.9% below) | $50.31M |
SPY fell 1.59% and closed $0.88 below its put wall. The $758 strike was also SPY's single biggest gamma strike that day at -$364.81M, so price had slid onto the most important level on the board, with total gamma negative. The call wall at $810 was far away. For context, options priced SPY's expected move to the November 2 expiry at about ±$6.93, a range of $750.19 to $764.05. The call wall wasn't in play for that expiry; the put wall was right at the price.
Nvidia closed between its walls. Its call wall at $212.5 was also its biggest strike, with $35.20M of positive gamma, and total gamma was positive at $50.31M. That's the setup where a call wall is most likely to slow a rally: dealers long gamma, with a big positive strike sitting 3.5% overhead.
When walls mislead
- After a big move, walls can sit on the wrong side of price. AMD fell 10.28% on October 30, 2026 to $508.22, and its put wall was $550, above the price. Walls describe where positions were built; a fast move can leave them behind.
- They move every day. Open interest is recounted overnight, so a wall can shift strikes after one session of heavy trading.
- Expiration can erase them. If most of a wall's gamma sits in one expiry, it disappears when that expiry rolls off. Monthly OPEX is the usual culprit.
- Far walls barely matter. Gamma fades away from the strike, so a wall several percent away has little pull today.
- News wins. A wall doesn't stop an earnings gap or a sector selloff.
How traders use walls
- As reference points for profit targets and stops, the way they'd use any heavily watched level.
- To judge strikes. A call bought at a strike beyond the call wall needs price to clear that level to pay off; a put bought below a put wall needs the level to break.
- Next to other levels. A wall that lines up with a heavy dark pool level or with max pain carries more weight than one standing alone.
How to see it on Tradytics
Open the options research page for any ticker, for example NVDA options, and find Dealer levels: gamma by strike around the price with the call wall, put wall and gamma flip marked. Or ask the AI analyst (Chat button on any page) "Where are SPY's gamma walls?" and it answers with the levels, the total and a chart. Dealer gamma is on every plan.
Common questions
Do call walls cap the price?
No. They tend to slow rallies when dealers are long gamma, most of all into expiration. Strong buying can push straight through, and the wall then moves up as new positions open.
Can a put wall be above the price?
Yes, after a sharp drop. AMD's $550 put wall sat above its $508.22 close on October 30, 2026.
Are walls just the strikes with the most open interest?
Sometimes. Gamma-based walls weight open interest by how much hedging each contract forces, so a strike near the price can outrank a bigger pile of contracts far away.
Is the put wall the same as max pain?
No. Max pain is the strike where expiring options pay out the least. Walls come from dealer gamma across expiries.
Sources
- SqueezeMetrics, Gamma Exposure (GEX), revised December 2017: GEX computed strike by strike from gamma and open interest.
- Ni, Pearson and Poteshman, Stock Price Clustering on Option Expiration Dates (Journal of Financial Economics, 2005): closing prices cluster at strikes on expiration dates.
- Options Industry Council, Open Interest: Why It Matters: open interest is recalculated by the OCC from each day's trades.
- SPY options traded $333.75M in premium on 2026-11-02: $193.28M in calls and $140.47M in puts, a net bullish lean of $31.85M.
- Put/call ratio 0.73.
- Options price a move of about ±$6.07 by 2026-11-02.
- Max pain for 2026-11-02 is $765.0.
Updated 2026-11-02 16:04 UTC