What is gamma exposure (GEX)?
By Faizan Ahmad. Updated .
Gamma exposure (GEX) estimates how much stock options dealers will have to buy or sell to stay hedged for every 1% the price moves, added up across every strike and expiry from open interest. When total GEX is positive, dealers trade against the move (they sell rallies and buy dips), which tends to calm the market. When it is negative, they trade with the move, which tends to amplify it. On October 30, 2026, SPY's total dealer gamma was -$335.55M: by the model, dealers would sell about that much SPY on a 1% drop and buy about that much on a 1% rise.
What does gamma exposure measure?
Options dealers (the market makers who take the other side of customer trades) don't want to bet on direction. When they sell you a call, they buy some stock so that small moves don't hurt them. The amount they hold is set by the option's delta, and delta keeps changing as the price moves. The speed of that change is gamma.
So gamma tells you how much hedging a single option forces as price moves. Gamma exposure scales that up to the whole market for a stock: every contract's gamma, times its open interest, times 100 shares, turned into dollars of stock per 1% move. The result is one number for the ticker, plus a number for each strike.
How do you read a GEX number?
Two things matter: the sign and the size.
- Sign. Positive means dealers are estimated to be net long gamma, so their hedging leans against moves. Negative means net short gamma, so their hedging chases moves. The full comparison is in positive vs negative gamma.
- Size. The number is dollars of stock per 1% move. SPY's -$335.55M on October 30, 2026 works out to about 443,000 shares of SPY at the $757.12 close for each 1% move (roughly $7.57). QQQ the same day was $180.48M, positive.
Size only means something next to how much the stock normally trades. A few hundred million dollars is small for SPY and would be enormous for a mid-cap stock.
| GEX can tell you | GEX can't tell you |
|---|---|
| Whether dealer hedging likely damps or speeds up moves | Which way the price will go |
| Which strikes carry the most hedging (the walls) | Exactly what dealers hold (nobody outside sees their books) |
| Roughly where the regime changes (the gamma flip) | What changed since the last open interest count |
What does GEX by strike show?
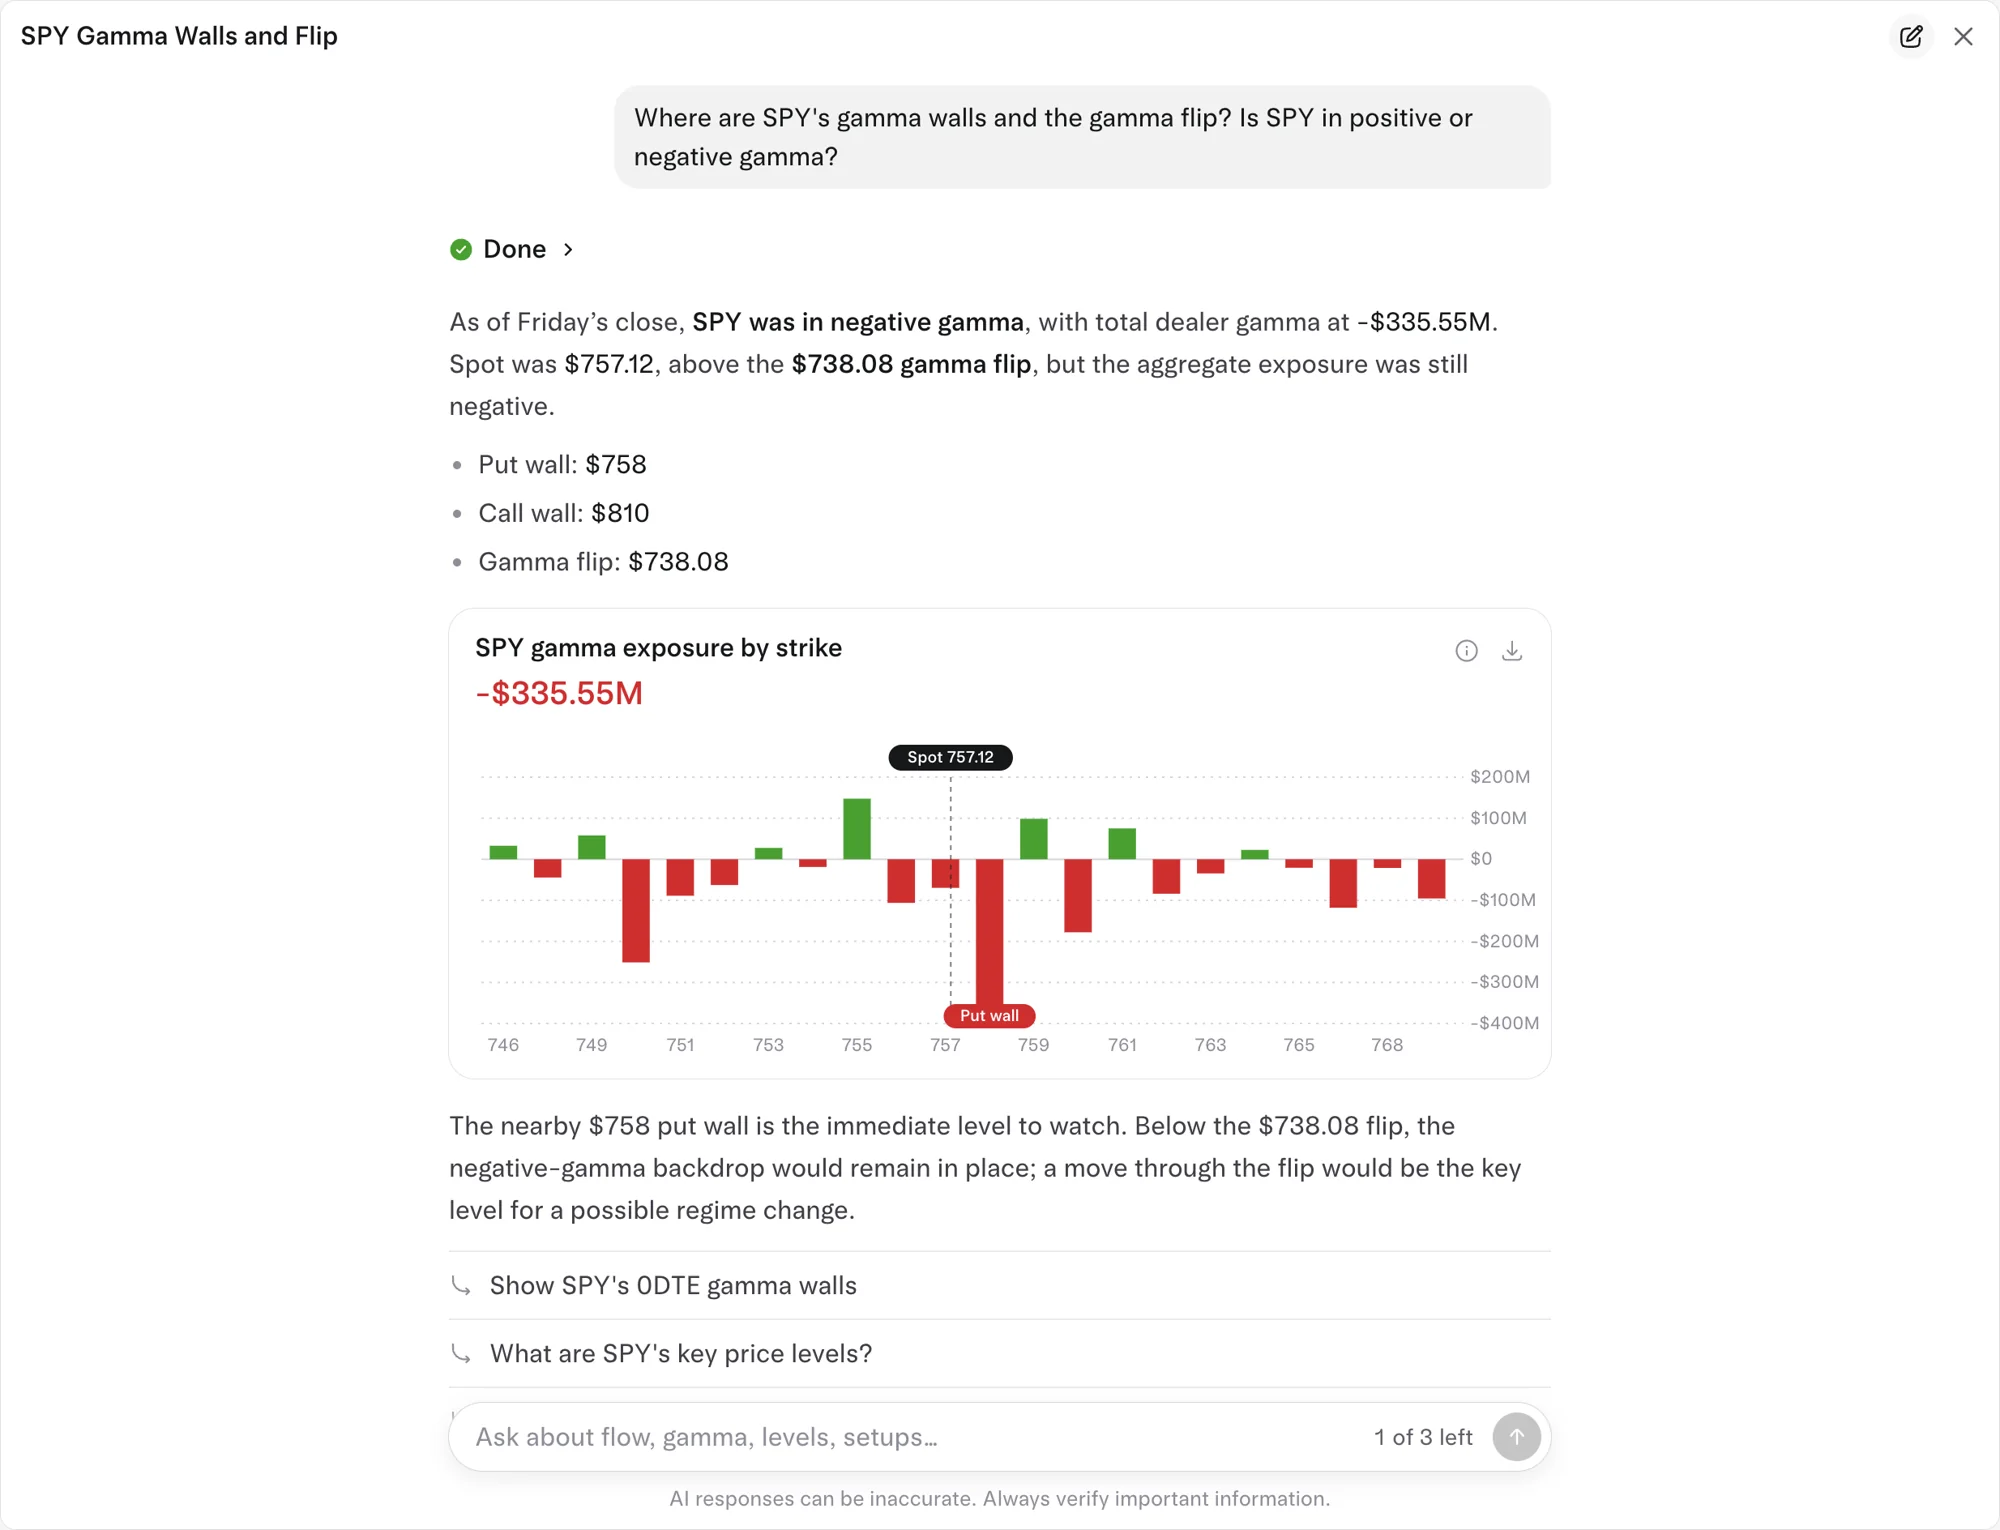
The total hides where the gamma sits. A by-strike chart shows a bar for each strike: green for positive gamma, red for negative. On October 30, 2026, SPY's biggest strikes were $758 (-$364.81M), $750 (-$251.12M), $770 (-$188.25M), $760 (-$177.86M) and $755 ($147.58M). The two strikes just above the $757.12 close, $758 and $760, held over $540M of negative gamma between them.
Three levels come out of that chart. The call wall and put wall are the strikes with the most positive and most negative gamma: $810 and $758 for SPY that day. The gamma flip is the price where the estimated total turns from positive to negative: $738.08 for SPY, though SPY closed above it with total gamma still negative, a mismatch that page explains.
Where does the GEX estimate come from?
Every GEX number is built from three inputs: open interest by strike, each option's gamma (which depends on price, time left and implied volatility), and an assumption about which side dealers are on. The common convention, laid out in SqueezeMetrics' original GEX paper, assumes investors sell calls and buy puts, so dealers are long calls and short puts. None of those inputs is perfect. Open interest is a once-a-day count, so anything opened or closed today, including most 0DTE trading, isn't in it. The formula and every assumption are broken down in how GEX is calculated.
Why do traders watch GEX?
Mostly to know what kind of day to expect. Positive gamma tends to mean tighter ranges and fades of big moves. Negative gamma tends to mean wider ranges and moves that run. Traders also use the walls as reference levels and watch how much gamma expires at monthly OPEX.
It is a backdrop, not a forecast. On October 30, 2026, QQQ ended the day in positive gamma and still fell 3.16%, about twice SPY's 1.59% drop, on a day technology stocks sank 4.55%. Whether GEX earns a place in your process is the subject of does gamma exposure actually help you trade.
How to see it on Tradytics
Open any ticker's options research page, for example SPY options, and scroll to Dealer levels: gamma by strike around the price, with the call wall, put wall and gamma flip, and the total in dollars per 1% move. You can also open the AI analyst from the Chat button on any page and ask "Where are SPY's gamma walls?" It pulls the dealer gamma and answers with the levels and a chart. Dealer gamma is on every plan, Free included.
Common questions
Is GEX the same as gamma?
No. Gamma belongs to one option. GEX adds up the gamma of every open contract on a stock, weighted by open interest and turned into dollars of hedging per 1% move.
Is negative GEX bearish?
Not by itself. Negative GEX means moves in either direction tend to get bigger. It often shows up after a drop, because falling prices bring heavy put strikes closer, but it doesn't predict the next move.
Why do GEX numbers differ between sites?
Each tool makes its own choices about the dealer-side assumption, which expiries to include, which implied volatility to use and how often to update. Cboe has noted published estimates of market maker gamma in SPX ranging from "record short" to long $50bn.
How often does GEX change?
The open interest behind it updates once a day, so the base picture changes overnight. The total also shifts during the day as price moves, because each option's gamma depends on where the stock is.
Sources
- SqueezeMetrics, Gamma Exposure (GEX), revised December 2017: the original GEX formula and the dealers-long-calls, short-puts assumption.
- Options Industry Council, Open Interest: Why It Matters: how the OCC calculates open interest from each day's opening and closing trades.
- Cboe, Evaluating the Market Impact of SPX 0DTE Options (September 8, 2023): on how widely estimates of market maker gamma disagree.
- SPY options traded $158.16M in premium on 2026-11-02: $82.10M in calls and $76.06M in puts, a net bearish lean of $1.85M.
- Put/call ratio 0.93.
- Options price a move of about ±$6.82 by 2026-11-02.
- Max pain for 2026-11-02 is $765.0.
Updated 2026-11-02 15:08 UTC