What is the options volatility surface? Term structure and skew explained
By Faizan Ahmad. Updated .
The volatility surface is implied volatility laid out across every strike and every expiry of a stock's options, a landscape instead of a single number. Cut it by expiry and you get the term structure: how much volatility the market prices for each deadline. Cut it by strike and you get the skew (or smile): how much more the market pays for downside puts than for upside calls, often summed up as 25-delta skew, the implied volatility of the 25-delta put minus that of the 25-delta call. Tradytics draws the surface in 3D for every optionable stock, next to the term structure, the skew, IV rank and percentile and the expected move.
What does the volatility surface show?
Each point on the surface is one contract's implied volatility: the move its price implies, as an annualized percentage. Put every strike across one axis, every expiry along another and IV as height, and the shape tells you what the market is worried about and when.
| Shape | What it usually means |
|---|---|
| Rising toward low strikes | Downside protection is in demand (puts are richer than calls) |
| Rising toward high strikes | Upside calls are in demand, as in squeeze-prone names |
| A ridge at one expiry | An event priced into that date, such as earnings |
| Higher at the front than the back | Stress now, expected to fade |
| Flat and low | A calm market with little priced in |
What is the volatility term structure?
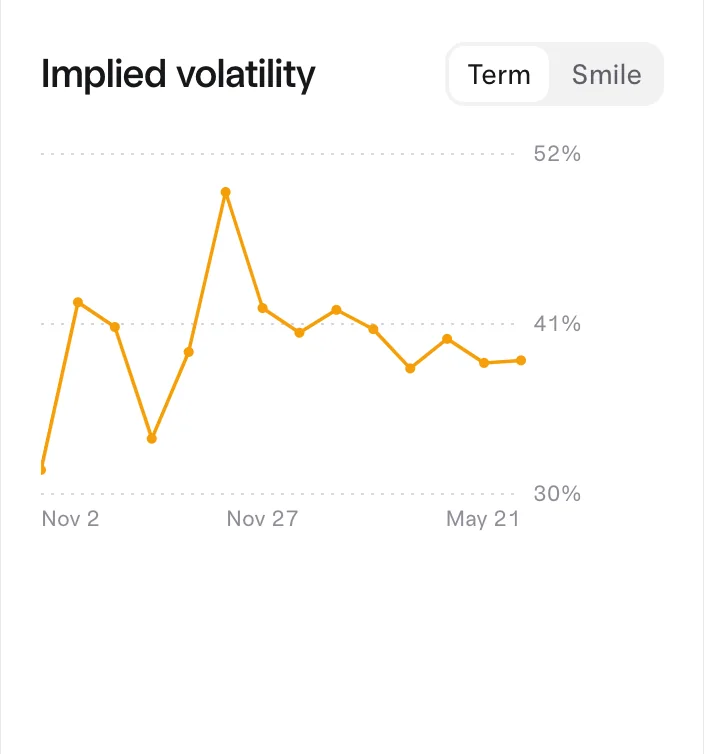
The term structure is at-the-money implied volatility by expiry, from the nearest to the furthest. Cboe compares it to the yield curve: a curve of what the market expects over different horizons.
- Upward sloping (contango). Later expiries carry more volatility than near ones. The usual shape in calm markets.
- Inverted (backwardation). Near expiries carry more than later ones. It shows up in selloffs and right before a known event, when the market pays up for the next few days.
- A bump at one expiry. Usually the first expiry after an earnings date or another scheduled event. That expiry carries the event premium, and it is the premium that drains out after the report in an IV crush.
On October 30, 2026, Tradytics showed NVDA's IV at 45.7%, while its options expiring Monday, November 2 were priced at 31.4%: the nearest expiry was pricing a much quieter few days than the stock's longer-dated options.
What is volatility skew?
Skew is how implied volatility changes across strikes within one expiry. For most stocks and nearly every index, out-of-the-money puts trade at higher IV than equally distant calls, because investors pay up to protect against a fall and crashes come faster than rallies. Drawn across strikes, it looks like a smirk that rises to the left. When both wings rise, it is called a smile.
What is 25-delta skew?
25-delta skew sums up the skew in one number: the implied volatility of the put with a delta of -0.25 minus the implied volatility of the call with a delta of 0.25, in the same expiry. Both are roughly equally far out of the money in probability terms, so the gap isolates how much more the market pays for downside than upside.
| 25-delta skew | What it means |
|---|---|
| Positive and normal for the stock | The usual premium for downside protection |
| Positive and rising | Demand for puts is growing: more fear, or more hedging |
| Near zero or negative | Calls are as rich as puts or richer: upside chasing, squeeze risk or a takeover story |
Conventions vary. Some desks quote it as call minus put (a risk reversal), or as a ratio. Compare a stock's skew with its own history, not with another stock's.
How do traders use the surface?
- Pick the expiry. The term structure shows which expiry carries an event premium you would be paying, or selling.
- Pick the strikes. The skew shows which wing is rich. In a steep put skew, a put spread sells some of that richness back.
- Judge the level. IV rank and percentile say whether today's volatility is high or low for the stock.
- Size the move. The expected move turns the at-the-money IV into dollars by expiry.
How does Tradytics show the volatility surface?
Open a stock's research options page and go to Implied volatility, for example NVDA implied volatility.
| Card | What it shows |
|---|---|
| Volatility surface | A 3D surface of out-of-the-money IV from 75% to 125% of the price across every expiry, strikes across, expiries into the page, IV as height and color. Drag to turn it; point at any face to read its expiry, strike, distance from the price and IV. |
| Skew | IV across strikes from 75% to 125% of the price for the nearest expiry and the expiries about a week, a month and three months out, one curve each, puts below the price and calls above |
| Term structure | At-the-money IV by expiry |
| 25-delta skew, IV rank and percentile, expected move | Where skew and volatility stand for the stock, and the move priced by expiry |
These are available for every optionable US stock and ETF, built from the whole options chain.
Common questions
What is an implied volatility surface?
Implied volatility for every strike and expiry of a stock's options, plotted together. Its expiry slice is the term structure and its strike slice is the skew.
What does an inverted volatility term structure mean?
Near-dated options carry more volatility than later ones, so the market expects the next few days to be rougher than the months after. It shows up in selloffs and before scheduled events.
How is 25-delta skew calculated?
The implied volatility of the 25-delta put minus that of the 25-delta call in the same expiry. Positive means puts are richer than calls, which is normal for most stocks and indexes.
Why are puts usually more expensive than calls?
Investors buy puts to protect portfolios, and markets tend to fall faster than they rise, so downside protection carries a premium. That premium is what skew measures.
Which Tradytics plan includes the volatility surface?
The 3D surface is on every Tradytics research options page under Implied volatility. Stock options research comes with Plus and Pro; plans are in Tradytics pricing.
Sources
- Cboe Global Indices, American and European-Style Theoretical Options Calculation Methodology: how implied volatility is backed out of option prices.
- Cboe, VIX Volatility Products: the VIX as the market's expectation of near-term volatility from S&P 500 option prices.
- Cboe, "Learning the Greeks: An Expert's Perspective" (April 27, 2021): delta as sensitivity to the underlying price, the measure 25-delta skew is built on.
- SPY options traded $763.86M in premium on 2026-11-04: $358.10M in calls and $405.76M in puts, a net bullish lean of $104.29M.
- Put/call ratio 1.13.
- Options price a move of about ±$6.67 by 2026-11-05.
- Max pain for 2026-11-04 is $755.0.
Updated 2026-11-05 07:45 UTC