What is the gamma flip level?
By Faizan Ahmad. Updated .
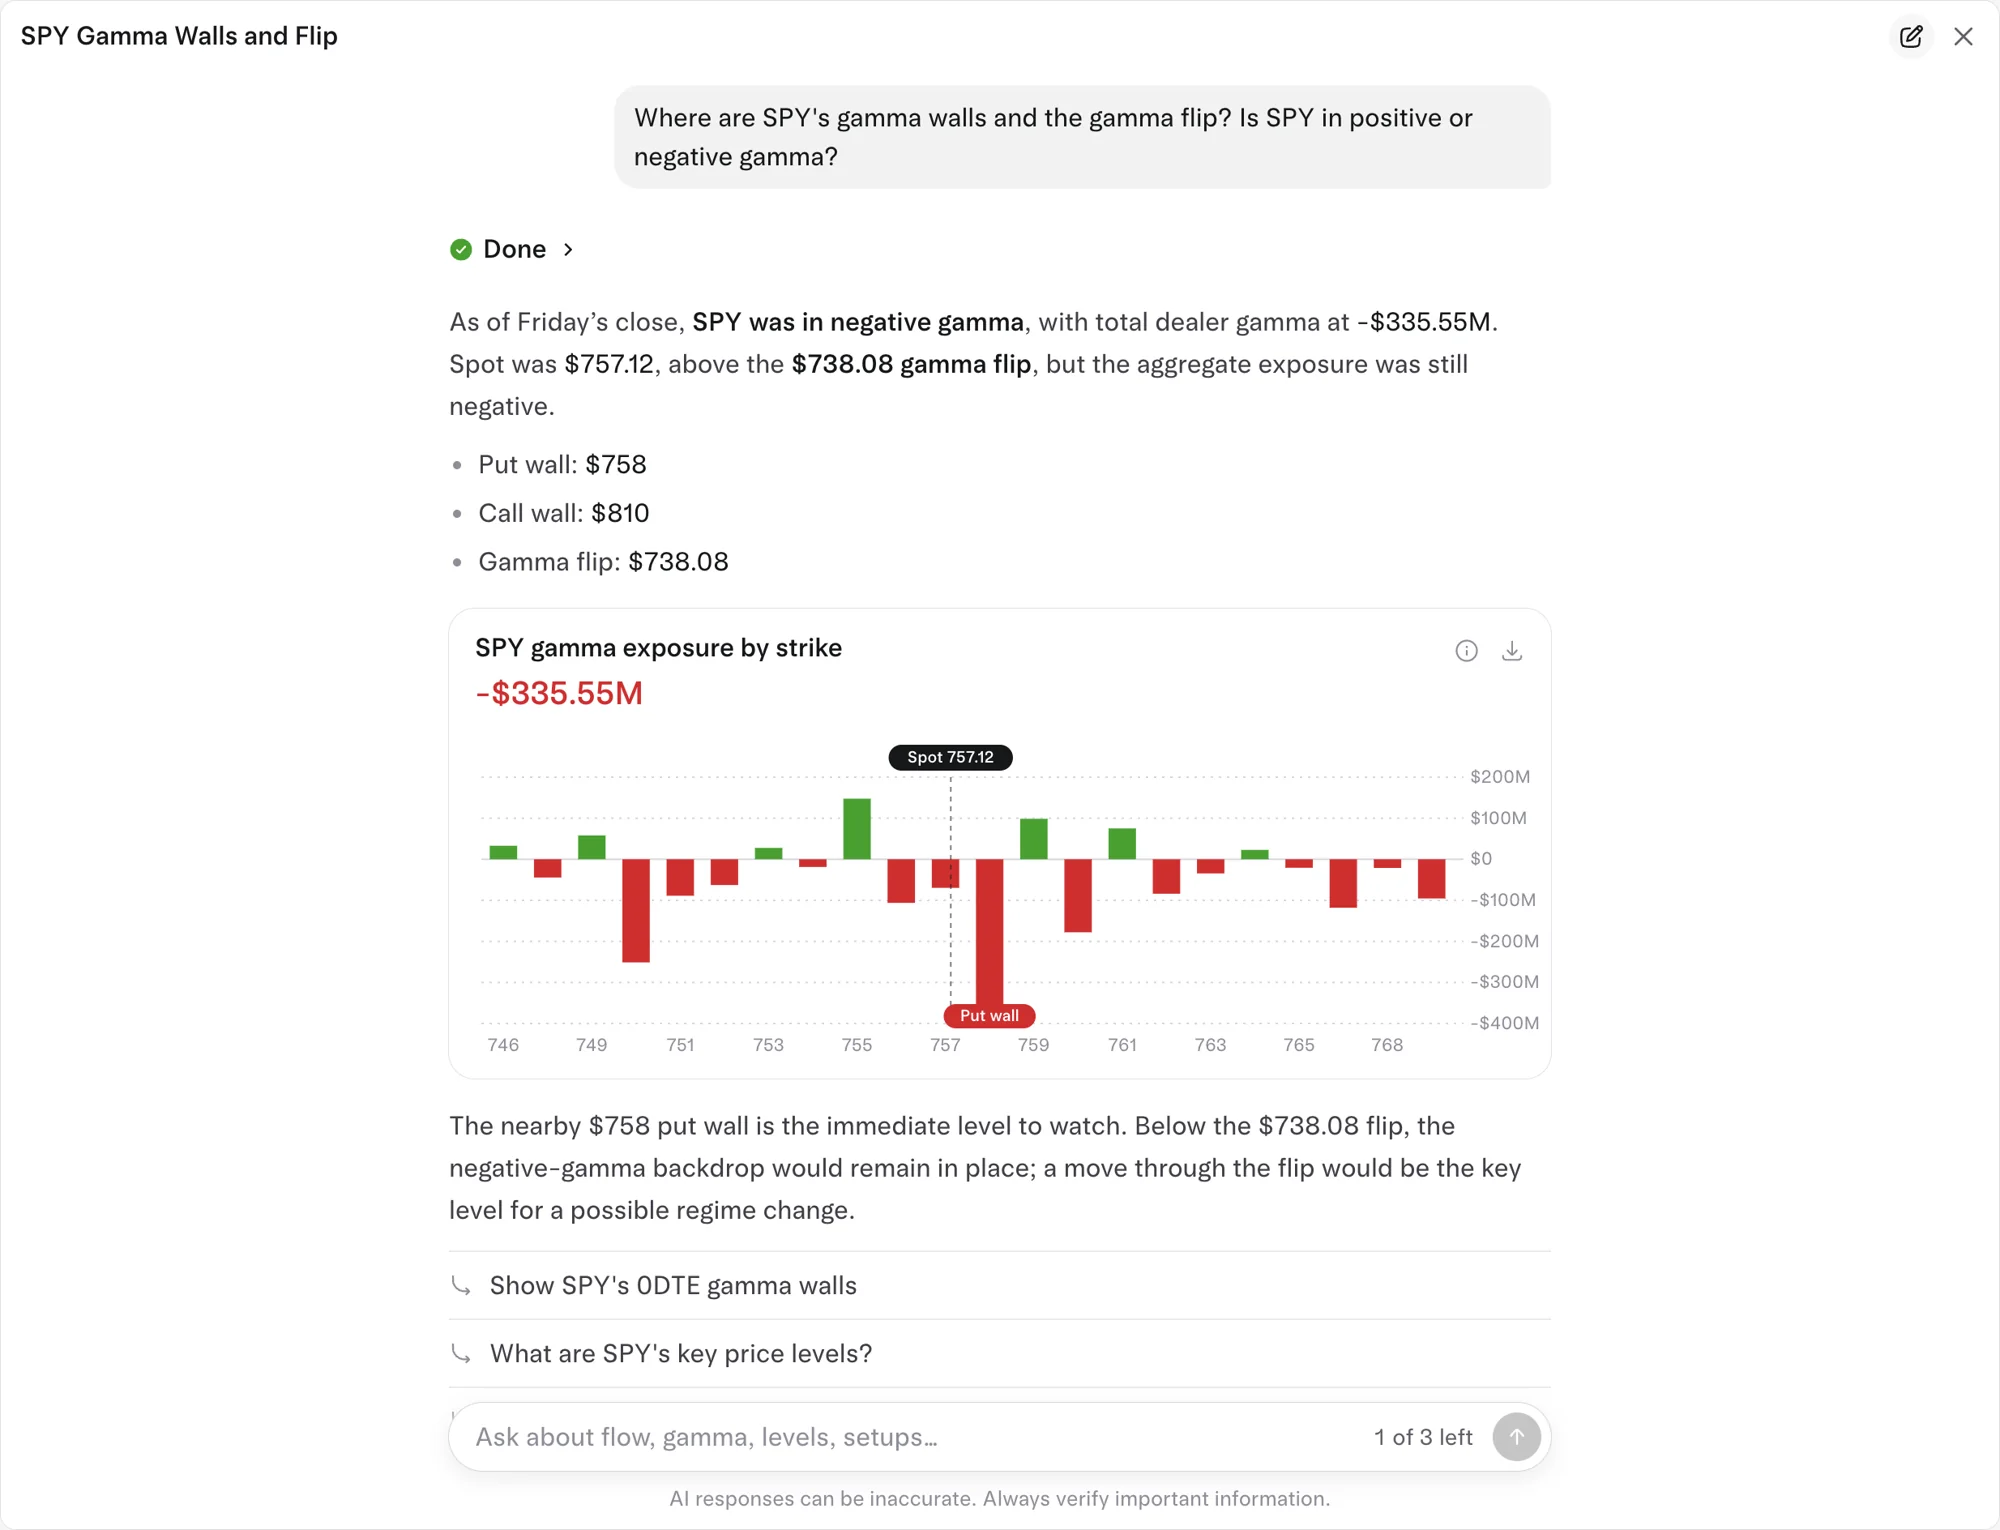
The gamma flip (also called the zero-gamma level) is the price where estimated total dealer gamma changes sign. Above it, dealers are modeled as net long gamma and their hedging tends to damp moves; below it, they are net short gamma and their hedging tends to amplify them. It is found by recomputing total gamma at a range of hypothetical prices and finding where the total crosses zero. On October 30, 2026, QQQ's gamma flip was $689.55, just $3.19 under its $692.74 close, and SPY's was $738.08.
How is the gamma flip calculated?
Total gamma exposure depends on where the stock is, because each option's gamma is biggest near its strike and fades away from it. So the flip is found with a simulation:
- Take today's open interest at every strike and expiry.
- Pick a hypothetical price, say 2% below today's.
- Recompute every option's gamma as if the stock were there, apply the dealer-side assumption (usually dealers long calls, short puts) and add it all up.
- Repeat across a grid of prices above and below today's.
- The flip is the price where that curve crosses zero.
Some tools take a shortcut and use the strike where cumulative gamma, added strike by strike, crosses zero. That gives a different number from the simulated curve, which is one reason flip levels disagree between sites. The inputs and their weak spots are covered in how GEX is calculated.
What happens when price crosses the flip?
| Price above the flip | Price below the flip | |
|---|---|---|
| Estimated dealer gamma | Net long (positive) | Net short (negative) |
| Dealer hedging | Sells rallies, buys dips | Buys rallies, sells dips |
| Typical behavior | Smaller ranges, moves fade | Bigger ranges, moves run |
| What traders watch for | Stalls near the call wall | Acceleration through put strikes |
The flip doesn't act like a wall that price bounces off. It marks where the character of trading is expected to change. SqueezeMetrics, which popularized GEX, put it this way: a reading near zero lets the market move without much interference from dealer hedging. The full contrast between the two regimes is in positive vs negative gamma.
The gamma flips on October 30, 2026
| Close | Gamma flip | Close vs flip | Total gamma | |
|---|---|---|---|---|
| QQQ | $692.74 | $689.55 | $3.19 above (0.46%) | $180.48M |
| SPY | $757.12 | $738.08 | $19.04 above (2.5%) | -$335.55M |
QQQ is the textbook case. It closed just above its flip with positive total gamma. After a 3.16% drop, a further 0.46% slide would have taken it below the flip and into negative gamma, so the flip was the level to watch at the next open.
SPY is the messy case, and the more useful lesson. It closed $19.04 above its flip, yet its total gamma was negative. That isn't a contradiction you should ignore; it tells you the gamma curve is lumpy. SPY's gamma near price was dominated by large negative strikes ($758 at -$364.81M and $750 at -$251.12M) with positive pockets in between ($755 at $147.58M). A lumpy curve can cross zero at more than one price, so a single flip number can't describe it. When the flip and the sign of the total disagree, trust the total and the big strikes first.
Why does the gamma flip move from day to day?
- Open interest changes overnight. New positions add gamma at their strikes; closed ones remove it.
- Expiries roll off. After a big expiration, especially monthly OPEX, a large chunk of gamma disappears and the flip can jump.
- Time passes. Gamma of near-the-money options rises as expiration gets closer, which reshapes the curve.
- Implied volatility shifts. Higher volatility spreads gamma out across strikes; lower volatility concentrates it.
How traders use the gamma flip
- As a regime line. Above it, many traders lean toward fading stretched moves. Below it, they give breakouts and breakdowns more room.
- As a risk filter. Some cut size when price trades under the flip, because ranges tend to widen.
- Next to other levels. A flip that lines up with a put wall or a heavy dark pool level carries more weight than one sitting alone.
Treat it as a zone of a few points, not a line to the cent. It is a model output built on open interest and assumptions about who holds what.
How to see it on Tradytics
The Dealer levels card on each options research page, such as QQQ options, shows gamma by strike with the gamma flip, call wall and put wall. The AI analyst (Chat button on any page) answers "Where is SPY's gamma flip?" with the level, where price sits against it and whether total gamma is positive or negative. Dealer gamma is on every plan.
Common questions
Is the gamma flip the same as the zero gamma level?
Yes, they name the same idea. Some vendors publish their own variations under other names, built with their own assumptions.
Does price bounce off the gamma flip?
Not reliably. The flip marks where hedging behavior is expected to change, not where buyers or sellers are waiting.
Why does a stock sometimes have no gamma flip?
If the estimated gamma curve stays positive or negative across the whole range checked, there is no crossing to report. Nvidia showed no flip on October 30, 2026, with total gamma at $50.31M.
Sources
- SqueezeMetrics, Gamma Exposure (GEX), revised December 2017: GEX near zero lets the market move without much hedging interference.
- Cboe, Evaluating the Market Impact of SPX 0DTE Options (September 8, 2023): why estimates of market maker gamma, and so flip levels, vary widely.
- Amaya, Garcia-Ares, Pearson and Vasquez (January 25, 2025): volatility runs higher when actual market maker gamma is negative.
- SPY options traded $335.90M in premium on 2026-11-02: $193.59M in calls and $142.32M in puts, a net bullish lean of $32.03M.
- Put/call ratio 0.74.
- Options price a move of about ±$6.07 by 2026-11-02.
- Max pain for 2026-11-02 is $765.0.
Updated 2026-11-02 16:05 UTC