Opening vs closing: how to tell from the flow
By Faizan Ahmad. Updated .
You can only be sure a trade opened new positions when its size is bigger than the contract's open interest: if 30,750 contracts trade when only 7,889 existed, at least 22,861 had to be new. When the size is smaller than open interest, the trade could be opening or closing and the tape can't tell you. The answer comes with the next open interest update, which the OCC makes after clearing the day's trades: a jump means positions were opened, a drop means they were closed.
Why does opening vs closing change the read?
"Calls bought at the ask" can mean two opposite things. A trader buying to open is starting a new bullish position. A trader buying to close is covering calls they had sold earlier, ending a bearish or income position. Same print, very different message. The four possibilities:
| Trade | What the trader is doing | Typical meaning |
|---|---|---|
| Buy to open | Starting a long option position | A new bet or a new hedge |
| Sell to open | Writing an option and collecting premium | A new short position: income, a view, or one leg of a hedge |
| Buy to close | Buying back an option they had sold | Covering: taking profit or cutting risk on a short |
| Sell to close | Selling an option they owned | Taking profit, cutting a loss, or lifting a hedge |
Every trade pairs one of these on each side. As the Options Industry Council puts it: when both sides open, open interest rises; when both close, it falls; when one opens and the other closes, it stays the same.
Test 1: Is the size bigger than open interest?
Open interest is the number of contracts still outstanding. Only contracts that exist can be closed, so any size above open interest has to be at least partly new. Real prints from October 30, 2026:
| Contract | Size | Open interest | At least this many new |
|---|---|---|---|
| SPY Jan 29, 2027 $716 put | 19,170 | 16 | 19,154 |
| QQQ Jun 17, 2027 $680 put | 30,750 | 7,889 | 22,861 |
| Seagate (STX) Nov 20, 2026 $655 put | 1,621 | 70 | 1,551 |
| Meta Feb 19, 2027 $730 call | 4,481 | 793 | 3,688 |
| Nvidia Jan 15, 2027 $170 put | 15,662 | 45,760 | Can't tell |
One caveat: open interest is last night's count. If someone opened contracts earlier the same day, a later trade could close them, so "bigger than open interest" means most likely new, not guaranteed. Tradytics' Opening tag means exactly this: size above open interest, so most likely a new position.
Test 2: Check open interest at the next update
When size is below open interest, wait. The OCC calculates open interest by consolidating the exchanges' trade reports, and it can only report the new figure after clearing and pairing the day's opening and closing positions. Once it does, compare:
- Open interest up by roughly the trade's size: it opened.
- Open interest down by roughly the trade's size: it closed.
- Little change: a mix, or one side opening while the other closed.
It isn't perfect. Open interest nets every trader in the contract, so one trader opening while another closes the same amount shows no change at all. A clear move in the direction of a single big print is still the best confirmation public data offers. The only direct record of opening and closing is a separate paid dataset, such as Cboe's Open-Close data for its own exchanges.
The hard case: Nvidia's January 2027 $170 puts
On October 30, 2026, Nvidia's three largest options orders were all in one contract, the $170 puts expiring January 15, 2027: 15,662 contracts at the ask for $6.26M, 13,344 at the bid for $5.34M and 12,205 at the ask for $4.81M, with the stock around $203. Together that's 41,211 contracts against open interest of 45,760.
That could be a fund rolling an existing hedge, closing one, adding to one, or several traders doing different things. Nothing on the day separates those stories, and a put about 16% out of the money with 77 days left is a typical hedge strike, so even the direction is unclear (see how to tell a hedge). The next open interest update is the tiebreaker: tens of thousands of new contracts would mean the position grew; a big drop would mean it was taken off.
Clues that a trade is closing
- It mirrors an earlier position: similar size, same contract, one you saw open days ago.
- It comes with a new leg in a later expiry or another strike at the same moment. That's a roll: close one, open the next.
- It's close to expiration, when holders close or roll rather than let options expire.
- It takes a big share of existing open interest on the opposite side of the original trade, like puts sold at the bid after a run of put buying.
How to see it on Tradytics
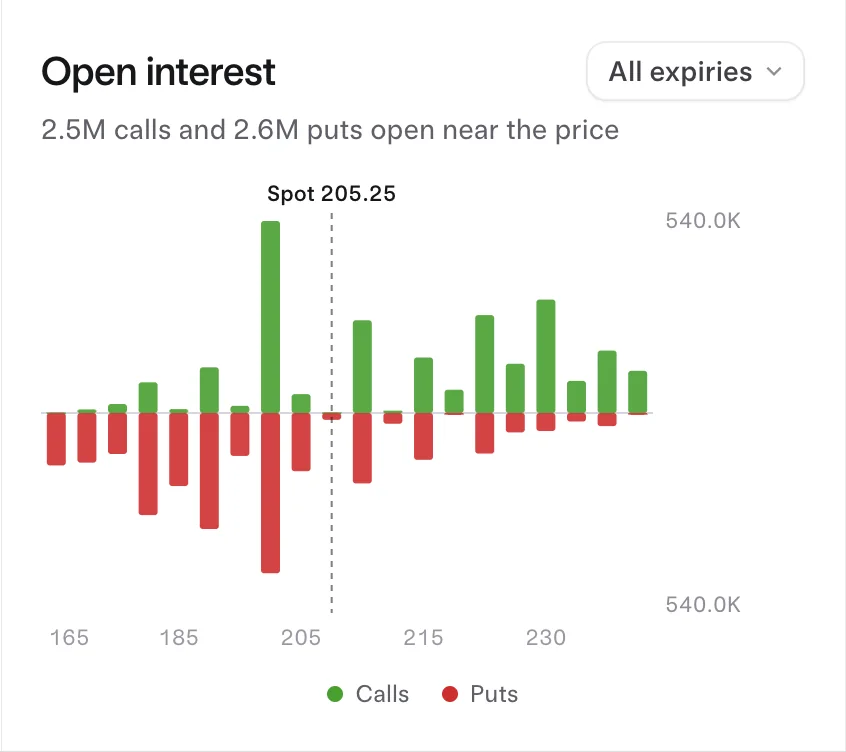
On the Live options flow page, the Opening tag marks every print bigger than open interest, and the OI and Vol/OI columns show the numbers behind it. To run the follow-up check, open the ticker's options page, such as NVDA's, where the open interest chart shows contracts open by strike and the largest orders card lists each trade's size next to open interest. For the full background, see volume vs open interest and what open interest is.
Common questions
Does the Opening tag guarantee a new position?
No. It means size beat last night's open interest, so the trade was most likely new. Opening and closing earlier the same day can blur it.
Why doesn't open interest change during the day?
The OCC can only report new open interest after clearing and pairing the day's opening and closing positions.
Can one trade be half opening and half closing?
Yes. The buyer can be opening while the seller closes, which leaves open interest unchanged.
Is a closing trade useless information?
No. A big hedge being lifted or a winning position being cashed tells you something too, just not that new money arrived. Whether the closer was the buyer or the seller is its own question (how to tell if a trade was bought or sold).
Sources
- Options Industry Council: Open Interest, Why It Matters: the OCC calculates open interest from exchange trade reports; the three rules for how opening and closing trades change it.
- Options Industry Council: General Information FAQ: the OCC can only report new open interest after clearing and pairing opening and closing positions at the end of the day.
- Cboe DataShop: Open-Close Volume Summary: a dataset that tags each trade on Cboe's exchanges as open or close and buy or sell.
- Most bullish options flow on 2026-11-02: MRVL ($22.86M net), AMZN ($15.80M net), TSLA ($12.08M net), LITE ($6.09M net), PLTR ($4.32M net).
- Most bearish options flow on 2026-11-02: AAPL ($40.91M net), AMD ($20.30M net), MU ($10.61M net), ORCL ($7.99M net), NVDA ($7.77M net).
Updated 2026-11-02 16:04 UTC