How to tell if an options trade was bought or sold
By Faizan Ahmad. Updated .
Every options trade has a buyer and a seller, so "bought or sold" really asks which side was aggressive. You tell by comparing the trade price with the best bid and ask at the instant it printed: at or above the ask, the buyer crossed the spread; at or below the bid, the seller did; near the middle, you can't say. No public feed records who started a trade, so every flow tool, Tradytics included, is making an informed inference from price, not reading a label.
Why can't anyone know for sure?
The consolidated options tape, published by OPRA, carries each trade's price, size, time and exchange, along with the quotes around it. It does not say who started the trade, who the buyer and seller were, or whether either one was opening or closing a position. That breakdown exists, but as a separate product: Cboe sells data that tags trades on its own exchanges as buy or sell and open or close, by type of trader (customer, professional customer, broker-dealer, market maker). Any flow feed built on the public tape has to infer the side.
How do flow tools infer the side?
They compare the fill with the national best bid and offer: the highest bid and lowest offer quoted on any options exchange at that moment. A buyer in a hurry pays the ask; a seller in a hurry accepts the bid. The closer a fill is to one edge, the more confident the read:
| Where it filled | Likely aggressive side | Confidence |
|---|---|---|
| Above the ask | Buyer | High: paid more than any seller was asking |
| At the ask | Buyer | High |
| Between the mid and the ask | Buyer | Medium |
| At the mid | Neither | None |
| Between the bid and the mid | Seller | Medium |
| At the bid | Seller | High |
| Below the bid | Seller | High: took less than any buyer was bidding |
What each label means in plain words, with call and put examples, is in what "at the ask" and "at the bid" mean.
Why does it matter? SPY on October 30, 2026
On October 30, 2026, SPY's options traded $1.09B in puts against $481.77M in calls, a put/call ratio of 2.26, on a day SPY fell 1.59%. Counted that way, it looks like heavy bearish betting. Split by side, the picture flips:
| SPY options | Bought | Sold |
|---|---|---|
| Calls | $144.57M | $119.20M |
| Puts | $354.12M | $384.30M |
More put premium was sold than bought, and more call premium was bought than sold. Bullish premium (calls bought plus puts sold) came to $528.87M against $473.32M bearish (puts bought plus calls sold), so SPY's net was a $55.55M bullish lean. The side is the difference between "traders bet on a crash" and "traders sold puts into the drop."
The same numbers show the limit. Those four boxes add up to about $1.00B, while SPY's total premium was about $1.57B. Roughly a third of SPY's premium printed too close to the middle to call either way.
When does the side read go wrong?
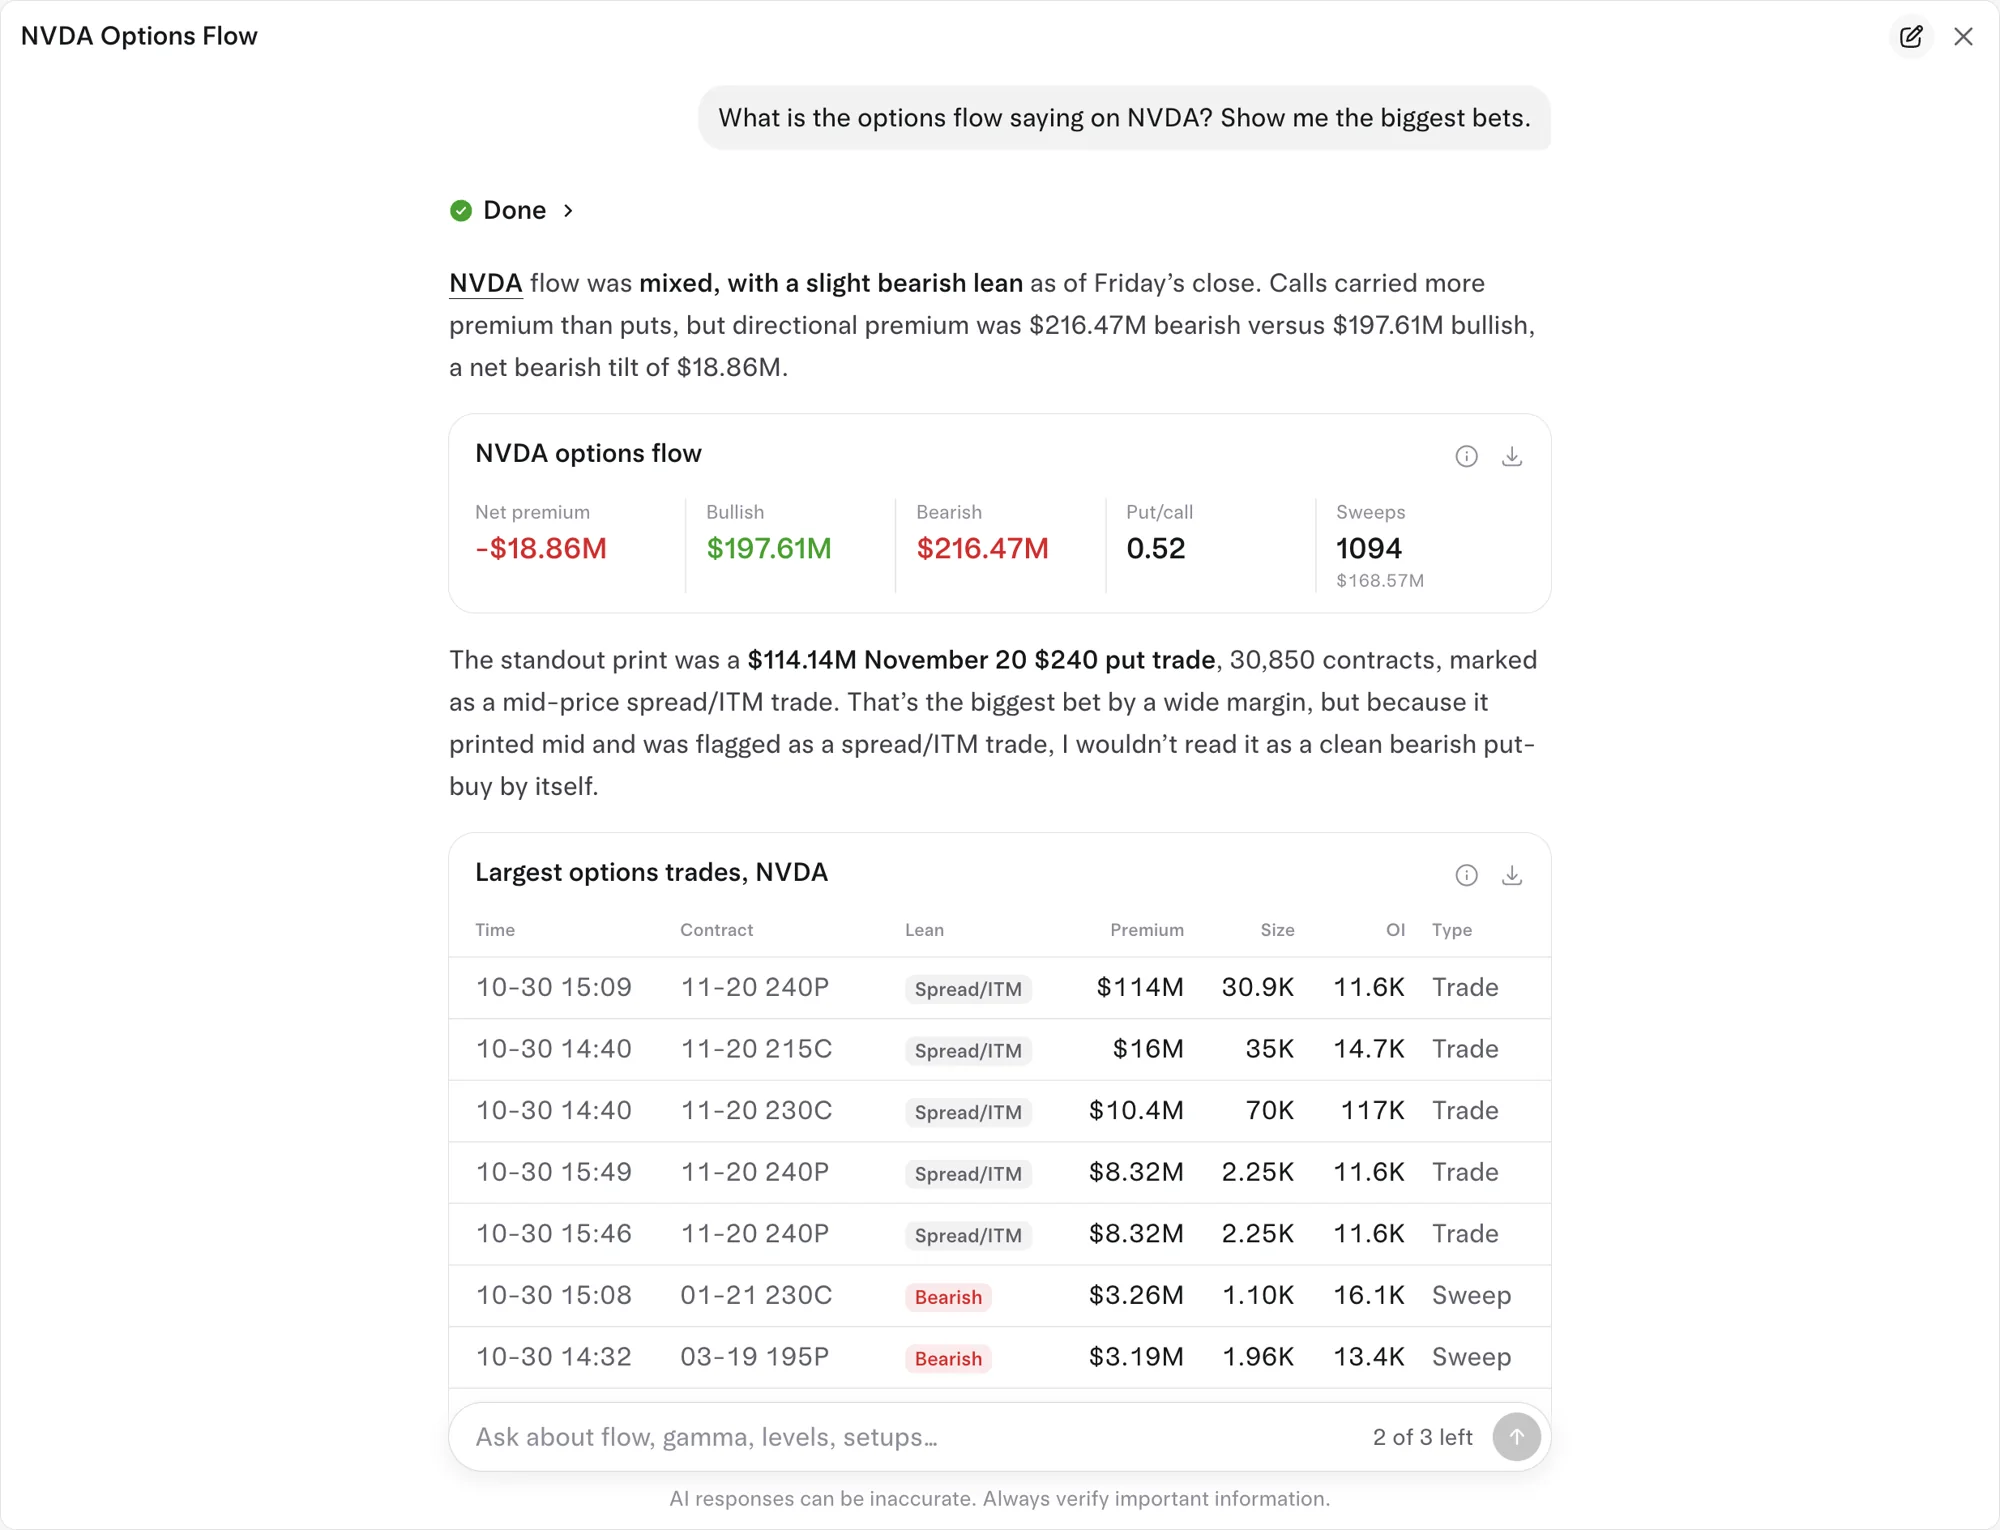
- Mid prints. Large negotiated and multi-leg trades often fill near the middle. Asked about Nvidia's flow, the Tradytics AI analyst flagged the biggest print, $114M in November 20 $240 puts, as a mid-price spread and said not to read it as a clean bearish bet.
- Spreads and complex orders. A multi-leg order is priced as one package, so a single leg can print at a price that looks aggressive against its own quote when it isn't (see reading spreads in the flow).
- Fast quotes. If the quote moves in the instant between the order and the print, the label can land on the wrong side.
- Sold isn't always bearish. On October 30, 2026, 1,000 Citigroup December 18 $50 calls were sold at the bid for $7.12M, about $71 a share, deep in the money. A shareholder selling deep in-the-money calls against stock they own is locking in a price and collecting cash, not betting on a fall.
- Bought isn't always bullish. A put bought at the ask is often insurance on shares (see how to tell a hedge).
How can you be more confident?
- Look for repetition: several prints at the ask in a row, or a sweep that took the offer on several exchanges at once (what a sweep is).
- Check size against open interest. A trade bigger than open interest had to open at least part of a position, which removes one source of doubt (opening vs closing).
- Look at every leg printed in the same second before reading any single row.
How to see it on Tradytics
Every row on the Live options flow page carries a side chip: Above ask, At ask, To ask, Mid, To bid, At bid or Below bid. For one ticker, the calls and puts card on its options page, such as SPY's, splits the day's premium into calls bought, calls sold, puts bought and puts sold. For a judgment call on a specific print, ask the AI analyst from the Chat button on any page.
Common questions
Why does my broker show volume but not buys and sells?
Because the public tape doesn't record who started a trade. Volume counts contracts that changed hands, and each one had both a buyer and a seller.
Is a trade at the ask always a buy?
The buyer was almost certainly the aggressive side, but that is still an inference, and a weaker one inside multi-leg orders.
Does it matter that a market maker took the other side?
Not for the read. Market makers fill a large share of orders and hedge themselves; what you want to know is which side came to them.
Can I see whether a trade opened or closed?
Not from the price. Size above open interest proves part of it was new; otherwise you check the next open interest update.
Sources
- Options Price Reporting Authority (OPRA): disseminates consolidated last sale and quotation information from the US options exchanges.
- Cboe DataShop: Open-Close Volume Summary: the separate dataset that categorizes trades by participant type, buy or sell, and open or close.
- SEC Release No. 34-45532, Federal Register (March 15, 2002): defines OPRA's best bid and offer as the highest bid and lowest offer quoted on any participant exchange.
- Most bullish options flow on 2026-11-02: MRVL ($23.33M net), AMZN ($16.59M net), TSLA ($11.89M net), LITE ($6.09M net), PLTR ($4.19M net).
- Most bearish options flow on 2026-11-02: AAPL ($40.79M net), AMD ($20.37M net), MU ($10.50M net), NVDA ($7.78M net), ORCL ($7.77M net).
Updated 2026-11-02 16:06 UTC