What is open interest?
By Faizan Ahmad. Updated .
Open interest is the total number of option contracts at a given strike and expiry that are still open: opened by a trade and not yet closed, exercised or expired. It is counted once a day from the clearinghouse's end-of-day records, so it stays fixed during the session and updates the next morning. Volume tells you how many contracts traded today; open interest tells you how many positions are still out there.
How does open interest go up or down?
Every trade has a buyer and a seller, and each side is either opening a new position or closing an old one. The options disclosure document defines an opening transaction as one that creates or adds to a position and a closing transaction as one that offsets it. The combination decides what happens to open interest:
| Buyer is | Seller is | Open interest |
|---|---|---|
| Opening a new long | Opening a new short | Up by the size of the trade |
| Opening a new long | Closing an existing long | Unchanged (the long changed hands) |
| Closing an existing short | Opening a new short | Unchanged (the short changed hands) |
| Closing an existing short | Closing an existing long | Down by the size of the trade |
Exercise and expiration also take contracts out of open interest. On expiration day, every contract in that series leaves the count.
When does open interest update?
Once a day. Cboe's data service explains that it starts each trading day with the previous night's end-of-day open interest from the OCC, the clearinghouse for US listed options, and that number stays the same all day until it refreshes the next morning. So during the session you can see volume pile up, but you can't see whether those trades opened or closed positions until tomorrow's open interest arrives. Comparing today's volume with tomorrow's open interest is the cleanest check, covered in opening vs closing trades and volume vs open interest.
A real example: what one day's trades can and can't tell you
On October 30, 2026 at 3:05 PM ET, 1,000 Citigroup December 18, 2026 $50 calls were sold at the bid for $7.12M, against open interest of just 107. Nobody can close more contracts than exist, so the seller could have closed at most 107 of them; at least 893 had to be new short positions. A single order that much bigger than open interest is one of the clearest signs of a fresh position, and a big part of what makes unusual options activity unusual.
Now the opposite case. At 9:53 AM the same day, 5,000 SPY December 18, 2026 $735 puts traded for $4.54M against open interest of 66,295. That order is small next to the existing position, so it could have been new protection or someone closing old protection, and during the session there is no way to tell. The next morning's open interest settles it, as long as little else traded in that contract: up by about 5,000 means opened, down by about 5,000 means closed, roughly flat means the position changed hands.
What does open interest tell you, and what doesn't it?
It tells you where positions sit. Strikes with large open interest are where traders have the most at stake, where liquidity is usually best, and the raw material for max pain and dealer gamma estimates.
It doesn't tell you who is long and who is short. Every open contract has one of each, so open interest by itself is neither bullish nor bearish. Here is how calls and puts stacked up on October 30, 2026:
| Ticker | Call open interest | Put open interest | Puts per call |
|---|---|---|---|
| SPY | 1,309,658 | 3,874,192 | 3.0 |
| QQQ | 1,287,205 | 3,455,194 | 2.7 |
| NVDA | 3,787,802 | 4,055,884 | 1.1 |
| AAPL | 949,328 | 814,835 | 0.9 |
| META | 583,036 | 195,951 | 0.3 |
The index ETFs carry about three puts for every call. That isn't a crowd betting on a crash: SPY and QQQ puts are where portfolios buy protection, and many of those contracts are hedges against stock the holder owns. Single stocks sit closer to even. Reading these ratios properly is the subject of the put/call ratio.
How to see it on Tradytics
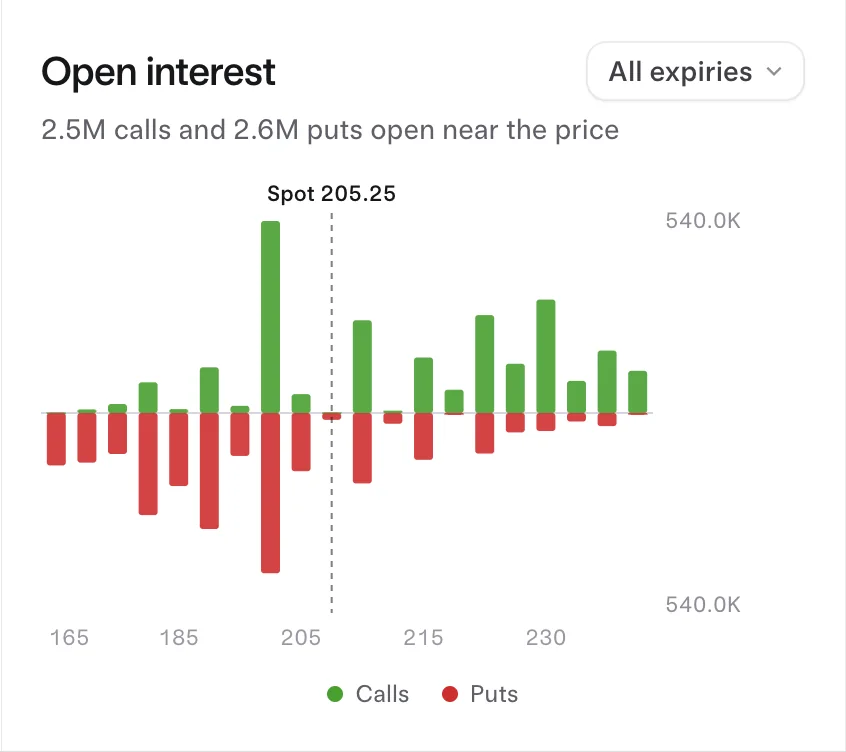
Each stock's research options page, such as NVDA options, charts open interest by strike for calls and puts, with max pain. On the live options flow page, every large print shows the contract's open interest and its Vol/OI, and trades bigger than open interest get an Opening tag. Free shows yesterday's session; Live and Pro see flow live, to the second.
Common questions
Is high open interest bullish?
Not by itself. Each open contract has a buyer and a seller, so large open interest only tells you a lot of positions exist at that strike, not which way they lean.
Does open interest change during the day?
No. It is set from the previous night's clearing data and updates the next morning.
How much open interest is enough to trade an option?
There's no fixed number, but more is better. Cboe lists strong open interest, tight bid/ask spreads and active volume as signs of a liquid option that's easy to get in and out of.
What happens to open interest at expiration?
It goes to zero for that contract. In-the-money options are generally exercised and the rest expire worthless.
Is open interest the same as volume?
No. Volume counts every contract traded today, including ones opened and closed within the day. Open interest counts only positions still open at the end of the day.
Sources
- Cboe DataShop, FAQs: open interest comes from the OCC's previous-night end-of-day figures and stays static during the day until the next morning.
- OCC and the US options exchanges, Characteristics and Risks of Standardized Options (June 2024): definitions of opening and closing transactions.
- Cboe Options Institute, glossary: strong open interest, tight spreads and active volume as signs of a liquid option.
- SPY options traded $333.35M in premium on 2026-11-02: $193.21M in calls and $140.14M in puts, a net bullish lean of $31.89M.
- Put/call ratio 0.73.
- Options price a move of about ±$6.07 by 2026-11-02.
- Max pain for 2026-11-02 is $765.0.
Updated 2026-11-02 16:03 UTC