Where does options flow data come from?
By Faizan Ahmad. Updated .
Options flow comes from OPRA, the Options Price Reporting Authority: every US options exchange reports its trades and quotes to OPRA, which merges them into one consolidated tape and sends it to every data recipient at the same moment. Each trade report carries the contract, price, size, exchange and a sale condition, but not who bought or sold or whether the trade opened or closed a position, so flow tools work out the side from where the price landed against the bid and ask. On a live feed the data is close to instant (OPRA's own processing took a median of 18.5 microseconds in August 2026); OPRA treats data as "delayed" once 15 minutes have passed, and free sites typically show delayed data.
How does a trade get from the exchange to a flow tool?
- An order executes on one of the US options exchanges. OPRA's August 2026 data specification lists 20 of them, run by seven groups: BOX, Cboe, IEX, MEMX, MIAX, Nasdaq and NYSE.
- The exchange sends a last-sale report to OPRA's processor, which SIAC runs on OPRA's behalf.
- OPRA merges every exchange's messages into one stream, works out the national best bid and offer, and transmits the stream to all recipients simultaneously.
- A data vendor reads the stream, keeps the prints that matter, judges each one against the best bid and offer, and groups related prints into sweeps, blocks and spreads.
- You see the result as a row on a flow page.
What's in an options trade report, and what isn't?
| On the OPRA tape | Not on the tape |
|---|---|
| The contract: symbol, expiry, strike, call or put | Who bought and who sold |
| The price and the number of contracts | Whether the trade opened or closed a position |
| Which exchange it printed on | Whether the trader was a customer, a firm or a market maker |
| A sale condition, such as intermarket sweep order, multi-leg, stock-and-option, late or cancelled | Which other prints were legs of the same order |
| Quotes, and the national best bid and offer | Why the trade was made |
| Open interest, sent once a day at about 6:30 a.m. ET | Open interest during the session |
That right-hand column is why flow is hard to read. The best-known research showing option volume predicts stock returns, by Jun Pan and Allen Poteshman, used a special CBOE dataset that recorded whether each trade was a purchase that opened a new position, and the authors point out that this information is not publicly observable. Everything a public flow tool says about side and opening is an inference, which is why telling whether an option was bought or sold is never certain.
What does a flow tool add to the raw tape?
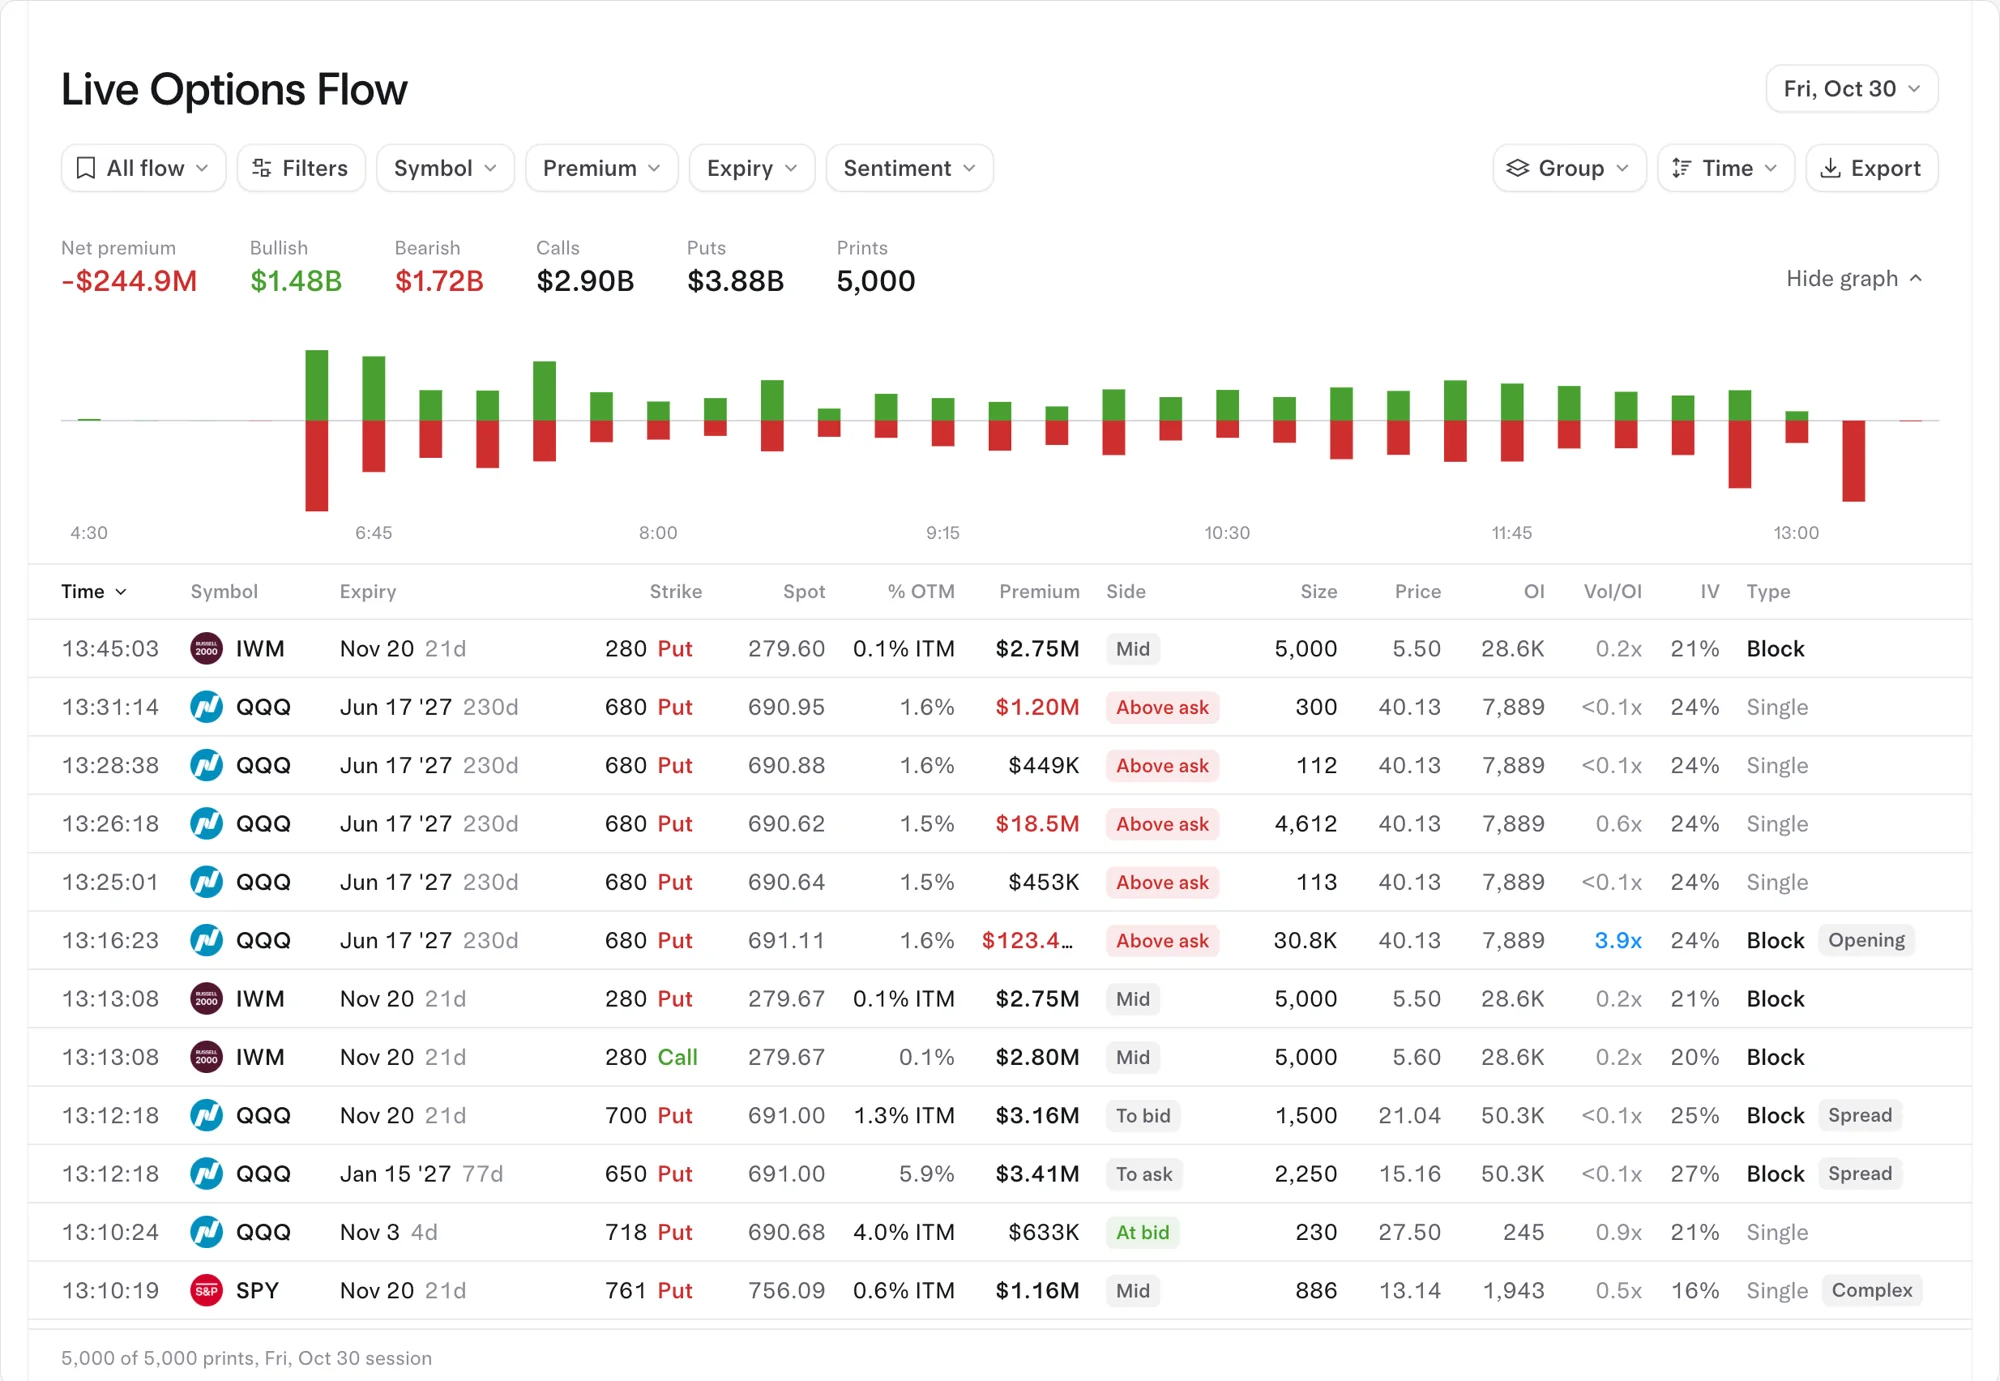
Take one print from October 30, 2026: 2,300 Amazon September 17, 2027 $260 calls at 9:43 AM. The tape supplies the contract, the size and the price, about $26.35 a share. The flow tool adds the rest:
- Premium: $6.06M (contracts times price times 100).
- Context: Amazon at $238.105 at that moment, so the strike sat about 9% above the stock.
- Open interest: 1,190 contracts open coming into the day, so the trade was 1.9 times the existing position, which is what earns an Opening tag on Tradytics (size bigger than open interest, so most likely new).
- Side: where the price landed against the best bid and offer, shown as a chip from Above ask to Below bid.
- Type: sweep (one order filled across several exchanges at once, which the tape's intermarket sweep flag helps identify), block (Tradytics marks any single trade of 5,000 contracts or more), split or single. Sweep vs block vs split explains each.
- Totals and filters: net premium, calls and puts, by stock, sector or the whole market.
Is options flow data real time or delayed?
| Feed | How fresh | Where you see it |
|---|---|---|
| Live ("current") | OPRA's processing took a median of 18.5 microseconds in August 2026, plus the vendor's own delivery time | Paid live flow plans; Tradytics Live and Pro, to the second |
| Delayed | At least 15 minutes after OPRA first sent it, by OPRA's definition | Free quote sites and many free tiers; OPRA charges no usage or device fees for delayed data |
| Historical | From the open of the next trading day, by OPRA's definition | Next-day review and research; Tradytics Free shows yesterday's session |
As of October 2026, the free flow tiers we checked ran from 15 minutes to two trading days behind; where to see options flow for free compares them.
Why does live options data cost money?
Partly licensing. OPRA's fee schedule charges vendors $1.25 a month for each nonprofessional subscriber (for the first 75,000), $1,500 a month to redistribute the data and $1,000 a month for direct access, while professional users pay $31.50 per display device a month. The bigger job is volume: OPRA's feed peaked at 59.4 million messages a second in August 2026, and its busiest day carried 194.8 billion transactions, almost all of them quote updates. Receiving, storing and classifying that stream in real time is where the work, and the cost, sits.
How to see it on Tradytics
Tradytics reads every US options exchange's trades from OPRA. The live options flow page lists the large prints with time, symbol, expiry and days to expiry, strike, call or put, spot, % out of or in the money, premium, side, size, price, open interest, Vol/OI, IV, type and tags, live to the second on Live and Pro, while Free shows yesterday's session. For a plan-by-plan view of every Tradytics data source, including dark pool timing, see where Tradytics gets its data. Pro also serves the same flow through the API.
Common questions
Do flow tools know who placed a trade?
No. The consolidated tape carries no buyer, seller or account, and no flag for opening or closing. Tools infer side from the bid and ask and infer opening from size against open interest.
Does every flow app use the same data?
The raw tape is the same: OPRA sends one consolidated stream to every recipient at once. What differs is which prints each app keeps, how it classifies them and how fast it delivers them.
Where does open interest come from?
It is published once a day before the open; OPRA sends open interest messages at about 6:30 a.m. ET. So today's volume is always compared with yesterday's closing positions, as explained in volume vs open interest.
Are there dark pools for options?
Listed options trade on the exchanges and print on OPRA, so there is no separate off-exchange tape like the one for stocks. More in are there dark pools for options?
Sources
- OPRA: a registered securities information processor that disseminates consolidated last sale and quotation information from the SEC-approved options exchanges; lists the participant exchanges; does not charge usage-based or device-based fees for delayed data.
- OPRA FAQs: SIAC gathers, consolidates and disseminates the data for OPRA; "current" data means data sent within the preceding 15 minutes.
- OPRA fee schedule: subscriber, redistribution and access fees; data becomes "delayed" after at least 15 minutes and "historical" at the next trading day's open.
- OPRA Binary Data Recipient Interface Specification (version 6.4b, August 25, 2026): participant exchange codes, last-sale message fields, sale conditions, simultaneous transmission to all recipients, open interest at about 6:30 a.m. ET.
- OPRA SIP operating metrics (through August 2026): peak of 59.4 million messages a second, 194.8 billion peak transactions a day and median latency of 18.5 microseconds in August 2026.
- Most bullish options flow on 2026-11-02: MRVL ($22.96M net), AMZN ($15.87M net), TSLA ($12.21M net), LITE ($6.09M net), PLTR ($4.27M net).
- Most bearish options flow on 2026-11-02: AAPL ($40.91M net), AMD ($20.61M net), MU ($10.90M net), ORCL ($7.78M net), NVDA ($7.78M net).
Updated 2026-11-02 16:03 UTC