How to read options flow, step by step
By Faizan Ahmad. Updated .
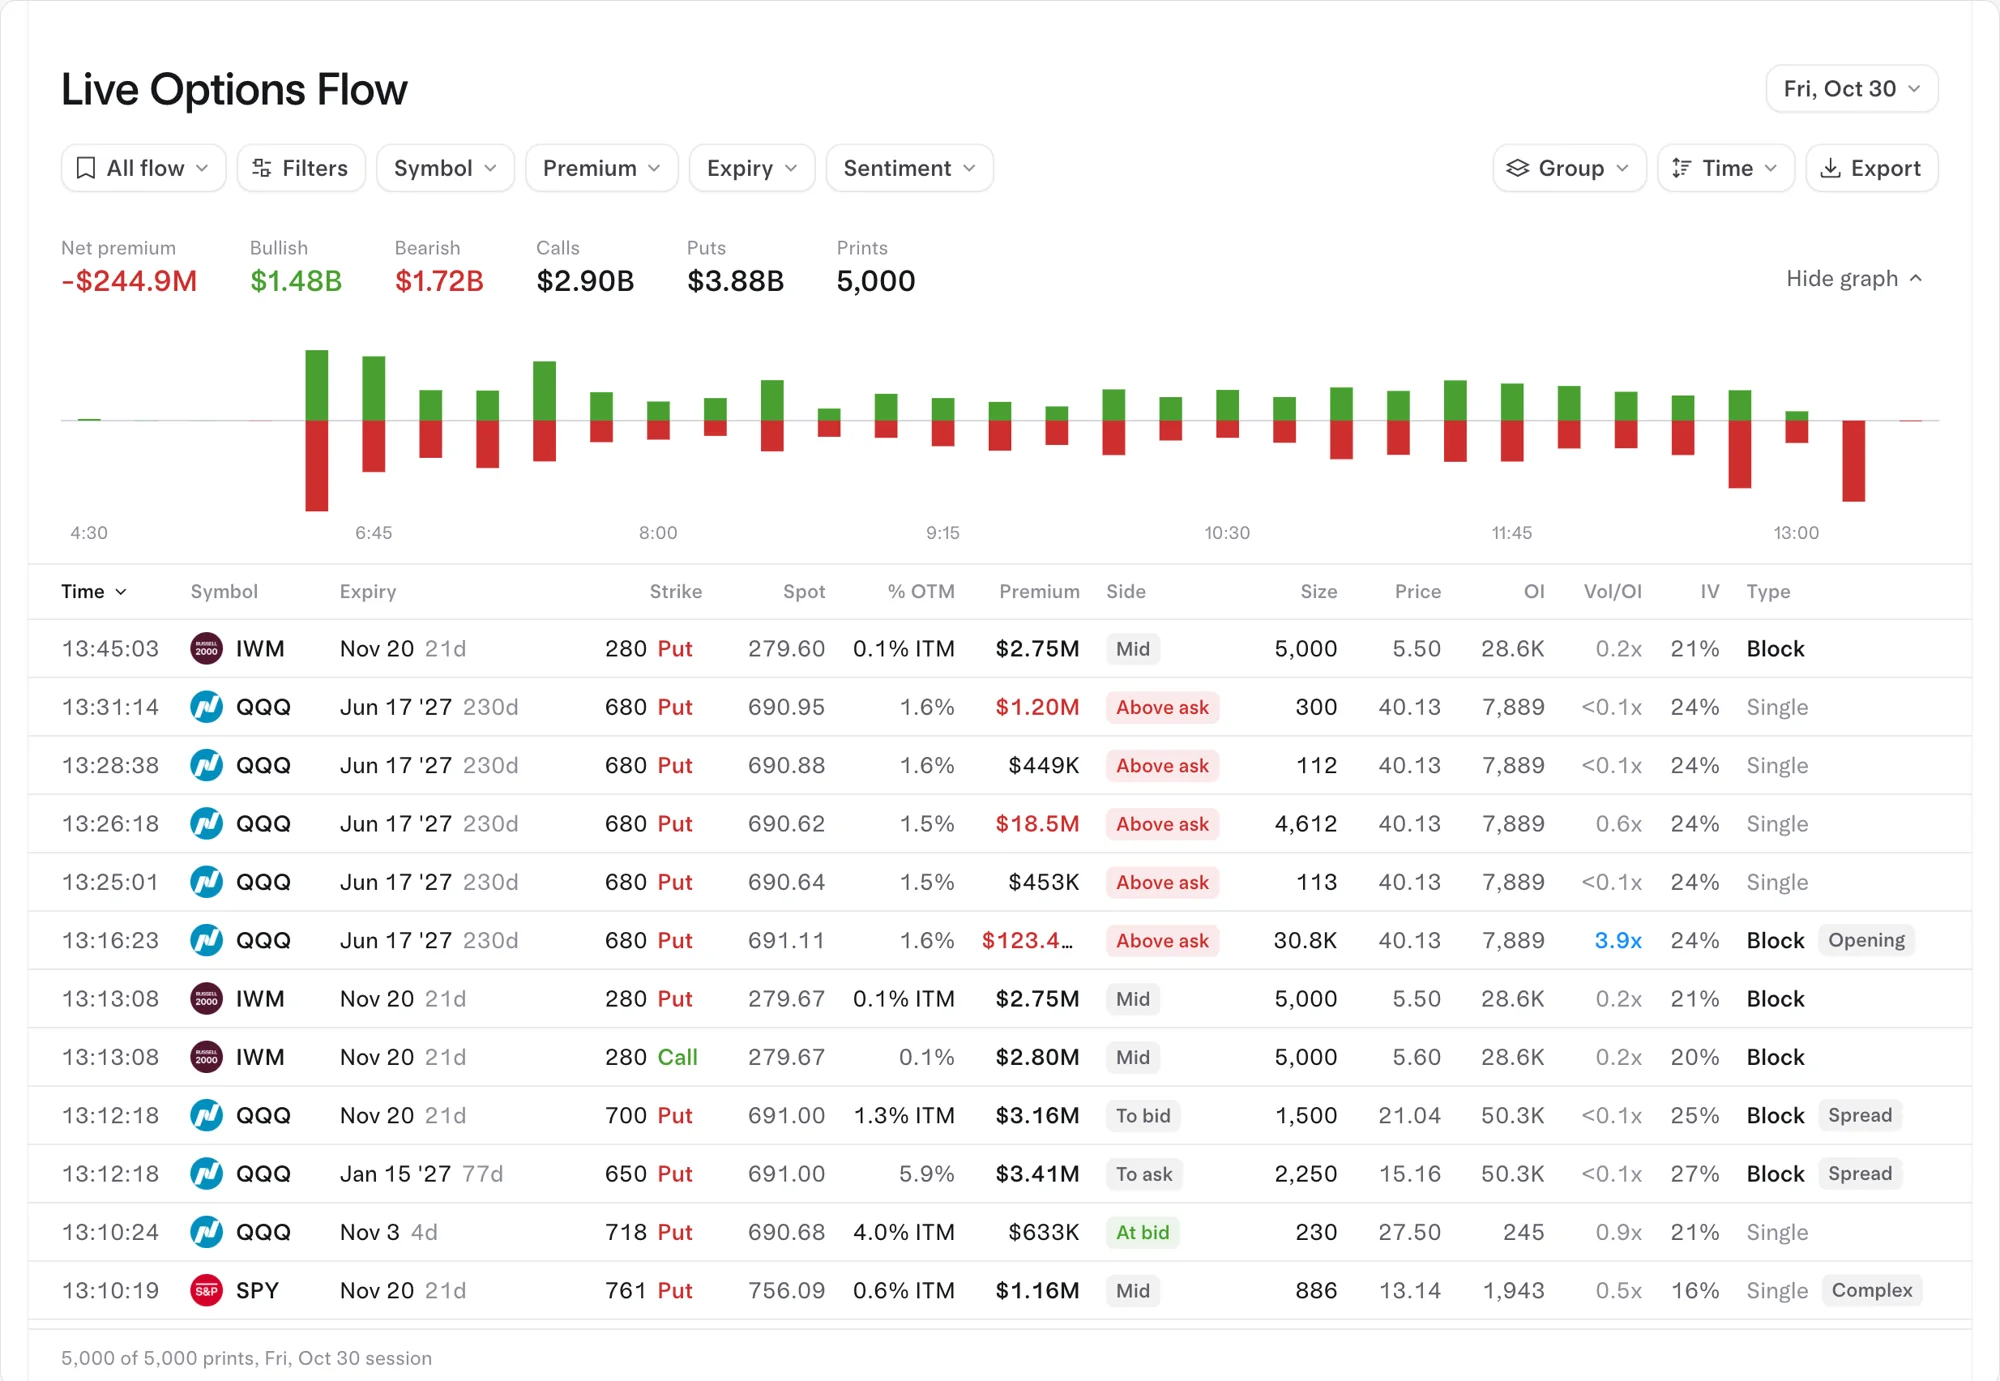
To read options flow, take each row in order: what was traded (ticker, call or put), when it expires, how far the strike is from the stock price, how much money was spent, which side was aggressive, whether the size beats open interest, and what kind of order it was. Then step back and check the context: other legs printed at the same moment, what the stock did that day, and whether a hedge explains the trade better than a bet. Below, one real row from October 30, 2026, read column by column.
The row we'll read
On October 30, 2026, with the Nasdaq 100 down 3.16%, this print hit the tape: 30,750 QQQ $680 puts expiring June 17, 2027, for $123.40M, against open interest of 7,889, with QQQ at $691.11. On the flow page it showed as Above ask, Block, Opening.
Step 1: What was traded?
QQQ is the ETF that tracks the Nasdaq 100. A put gains value when the underlying falls, so the buyer profits if QQQ drops far enough below $680 to cover what was paid. Note the instrument: index ETFs like QQQ and SPY are where funds hedge whole portfolios, which matters in step 8.
Step 2: When does it expire?
June 17, 2027 is 230 days away. Long-dated options lose value slowly and give a trade months to work; a contract expiring this week needs a move right now. Short-dated flow is about the next few days, long-dated flow is about positioning (more in short-dated vs LEAPS flow).
Step 3: How far is the strike from the price?
$680 against $691.11 is 1.6% out of the money. Strikes near the price cost more but start paying off after a small move. Strikes far out of the money are cheap and need a big one.
Step 4: How much money went in?
Premium is contracts × price × 100. Here, 30,750 × $40.13 × 100 = $123.40M, the largest QQQ order of the day. Premium, not contract count, is the real measure of commitment (see why premium matters more).
Step 5: Which side was aggressive?
Above ask means the buyer paid more than the best price any seller was offering, typically because the order was bigger than the size on offer. That is an aggressive buy, and a put bought aggressively leans bearish. Had it printed at the bid, the seller would have been the aggressive side and the lean would flip. Every side label is explained in what "at the ask" and "at the bid" mean.
Step 6: Is it a new position?
30,750 contracts against 7,889 open is a Vol/OI of 3.9x. Even if every existing contract had been closed in this trade, at least 22,861 had to be new, which is why the row carries the Opening tag. When size is below open interest you can't tell on the day; opening vs closing explains the next-day check.
Step 7: What type of order was it?
Block: Tradytics marks any single trade of 5,000 or more contracts as a block, so this was institutional size, not a retail order. The other types tell you how an order was worked: a sweep is one order filled across several exchanges at once (urgency), a split is a large order filled in pieces on one exchange, and a single is one ordinary print.
Step 8: Put it in context
A row read alone is half a read. Three checks:
- Other legs. Look for prints in the same name at the same moment: a sold call or a cheaper put would turn this into a collar or a put spread. No other leg shows up alongside this one, but the same $680 strike kept trading above the ask in the minutes after, including 4,612 contracts for $18.51M.
- The stock's day. QQQ fell 3.16%, and buyers of QQQ puts outspent sellers, $614.45M to $572.52M.
- Bet or hedge. Long-dated, near the money, on an index ETF, at portfolio scale, bought into a selloff: those are the marks of insurance.
Step 9: Write the one-line read
Sum it up in a sentence you could defend: "Someone paid $123.4M for seven months of downside protection on about 3.08 million QQQ shares, roughly $2.1B of stock at the price then, opened fresh on a 3% down day." That covers both readings. If it is a hedge, big holders are nervous but staying invested. If it is a bet, it is a large and patient one, not a call for a crash tomorrow. How to weigh the two is the subject of how to tell if a big options trade is a hedge.
The checklist on one screen
| Step | Column | Ask yourself | The QQQ $680 put |
|---|---|---|---|
| 1 | Symbol, call or put | What gains, and on what move? | QQQ put: gains if the Nasdaq 100 falls |
| 2 | Expiry | How long does it have? | 230 days |
| 3 | Strike, % OTM | How far must the stock move? | 1.6% out of the money |
| 4 | Premium | How much is at risk? | $123.40M |
| 5 | Side | Who was aggressive? | The buyer (above ask) |
| 6 | Size, OI, Vol/OI | Is it new? | 3.9x; at least 22,861 contracts new |
| 7 | Type, tags | What kind of order? | Block, Opening |
| 8 | Context | Other legs, the stock's day, hedge? | Index puts bought into a selloff: likely protection |
Common mistakes when reading flow
- Counting contracts instead of premium.
- Reading every put as bearish and every call as bullish without checking the side.
- Treating Mid prints as bets. A fill at the midpoint has no clear side.
- Reading one leg of a spread as a standalone bet.
- Chasing a print after the stock has already moved.
How to see it on Tradytics
The Live options flow page shows every column used above, with Symbol, Premium, Expiry and Sentiment filters across the top to cut straight to the rows that matter. For one ticker's biggest trades with size next to open interest, open its options page, such as QQQ's. If a row puzzles you, ask the AI analyst (the Chat button on every page): it pulls the flow and tells you whether a trade looks like a hedge, a spread or a fresh bet. Flow is live to the second on Live and Pro; Free shows yesterday's session.
Common questions
What does Vol/OI mean?
The trade's size (or the day's volume) divided by open interest. Above 1 means more contracts traded than existed before the session, so at least part of it is new.
Should I copy big trades?
No. You don't know the trader's full position, their cost or their exit, and many big prints are hedges. Use flow to test an idea, not to replace one.
Why do some rows say Mid?
The trade filled near the midpoint between the bid and the ask, so neither side was clearly aggressive. Big negotiated and multi-leg trades often print there.
Is a single print enough to act on?
Rarely. Repeated opening trades at the same strike over several sessions, filled at the ask or the bid, say far more than one row.
Sources
- Options Price Reporting Authority (OPRA): the consolidated last sale and quote feed from every US options exchange that flow tools read.
- FINRA: Options: calls, puts, premium and the definition of open interest.
- Options Industry Council: Open Interest, Why It Matters: how opening and closing trades raise, lower or leave open interest unchanged.
- Most bullish options flow on 2026-11-02: MRVL ($13.54M net), GOOGL ($7.70M net), TSLA ($5.32M net), CVNA ($3.08M net), NOW ($2.91M net).
- Most bearish options flow on 2026-11-02: AAPL ($16.02M net), MU ($11.83M net), NET ($10.00M net), ORCL ($9.55M net), NVDA ($6.73M net).
Updated 2026-11-02 15:11 UTC