How to read dark pool prints
By Faizan Ahmad. Updated .
Read dark pool prints as a group, never one at a time. First throw out prints far from the market price, because they are late reports or trades priced off an earlier close. Then set aside trades done at the closing price, compare what's left with the stock's usual day, and look for prices where dollars piled up across several sessions. Never read a single print as a buy or a sell: the public record doesn't say which side started the trade.
Here is that routine on one real day: Nvidia on October 30, 2026, when the stock fell 3.94% to $205.25 in a chip selloff.
Step 1: Is the print at the market price?
Start with the price, not the size. At 8:11 AM ET, a dark pool print showed 1,699,812 Nvidia shares at $213.66, a $363.18M trade. Nvidia closed that day at $205.25 after a 3.94% drop, which puts the previous close at about $213.67. So this print was priced at the prior day's close. It wasn't someone paying up $8 above the market.
Prints far from the current price are usually late reports or trades priced off an earlier reference. The biggest such print that day was in SPY: $2.84B at $769.559, reported at 4:28 PM ET, about $12 above SPY's close. Treat these as history. They say nothing about demand at that price today. What is a late dark pool print? explains the codes behind them.
Step 2: Is it a closing-price trade?
At 5:00 PM ET, Nvidia printed 1,699,812 shares at $204.64, worth $347.85M. Same share count as the 8:11 AM print, to the share. And $204.64 is exactly the price of Nvidia's 4:00 PM closing auction on Nasdaq, where 30,459,238 shares traded for $6.23B.
Two identical blocks at two consecutive closing prices is the fingerprint of a trade done at the closing price and reported outside regular hours. It tells you a block changed hands at the close, not that anyone wanted Nvidia at $204.64. Microsoft and Amazon showed the same pattern that day, which are dark pool prints bullish or bearish? lays out. And the closing auction itself traded on Nasdaq, so it's an exchange block, not a dark pool print.
Step 3: What traded during the session?
Now look at what's left: prints during regular hours near the market price. Nvidia's biggest was at 3:09 PM ET: 3,085,000 shares at $203.085, a $626.52M dark pool trade, about 1% below where the stock closed. That is the print worth noting. A real block changed hands late in a down day, near $203.
Even here, you don't know the side. A seller unloading into a falling market and a buyer stepping in on weakness produce the same print.
Step 4: How big is it next to a usual day?
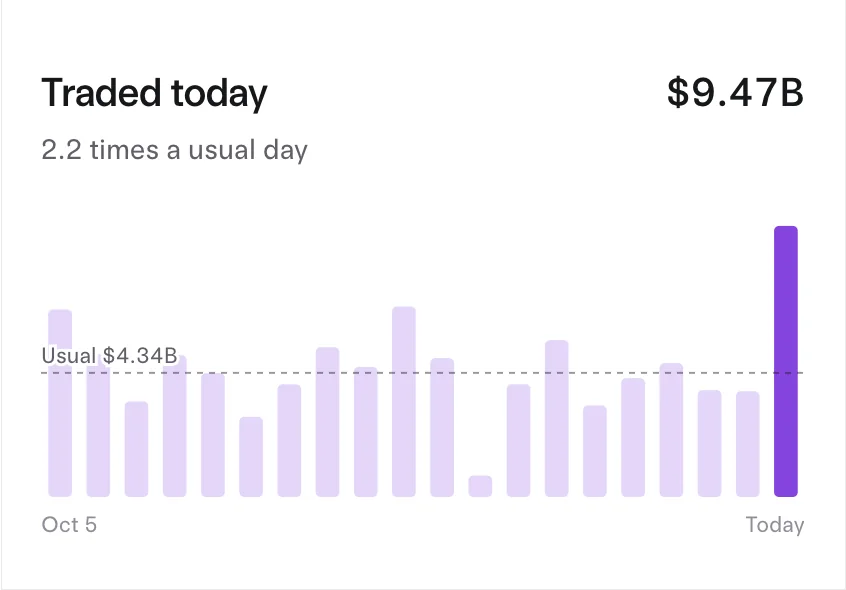
Dollar value means little on its own. Nvidia sees $4.34B of large dark pool and block trades on a usual day, so the 3:09 PM print was about 14% of a normal day in one trade. For SPY, whose usual day is $6.37B, the same dollar amount would be about 10%. For a smaller stock it could be more than a whole usual day.
Two checks help: the single print against the usual day, and the whole day against the usual day. A day running at two or three times normal tells you institutions were busy, whatever the direction.
Step 5: Where did dollars pile up over days?
Single prints are noise. Prices where dollars accumulate across sessions are what traders watch, and those are dark pool levels. Nvidia's biggest levels over the 10 sessions to October 30:
| Level | Dollars | Prints | Versus the $205.25 close |
|---|---|---|---|
| $204.64 | $2.34B | 70 | At the price |
| $216.16 | $2.08B | 63 | Above |
| $217.10 | $1.66B | 39 | Above |
| $213.66 | $1.42B | 29 | Above |
| $215.35 | $1.38B | 47 | Above |
Levels inherit the same traps as single prints. The top level sits at exactly the October 30 closing auction price, and closing-price prints like the 5:00 PM block from Step 2 feed it, so it isn't a price buyers defended during the day. The $213.66 level matches Nvidia's previous close, and the 8:11 AM print from Step 1 is about a quarter of it on its own. Even with those caveats, the four levels from $213.66 to $217.10, $6.54B in 178 prints, all sit above the price. Traders who watch levels see a zone like that as overhead: recent buyers who still hold are under water there.
Step 6: Don't assign a direction
Every print has a buyer and a seller. The SEC notes that many dark pools match at prices taken from the exchanges and some only at the midpoint, where neither side crossed the spread, so the "bought at the ask" logic from options flow doesn't carry over. Use prints as a map of where size traded, then check other evidence. On October 30, Nvidia's options flow netted $19.61M, a slight bullish lean, on a 3.94% down day. Neither source tells you the next move alone.
A quick checklist
| What you see | What it usually is | What to do |
|---|---|---|
| Price far from the market, like $213.66 with the stock near $205 | A late report or a trade priced off an earlier close | Ignore it for direction |
| Same share count at two closing prices | A trade done at the close | Ignore it for direction |
| A giant 4:00 PM print on an exchange | The closing auction | Count it as an exchange block, not dark pool |
| A large in-session print near the market price | A real block changed hands | Note the price and size versus a usual day |
| Dollars piling up at one price over many prints and days | A level | Watch how price behaves there |
Why the timing of a print doesn't matter much
Dark pool prints are after-the-fact reports by nature. FINRA requires off-exchange trades to be reported within 10 seconds of execution and marks later reports as late, and the biggest ones, such as negotiated blocks, average-price and portfolio trades, are often reported late, sometimes hours later, at a price from earlier in the day. Tradytics shows prints within about 15 minutes of their report. Because you read dark pool data for levels built from 10 sessions of prints, not for the second a print happened, that window changes nothing about the levels.
How to see it on Tradytics
Open a stock's dark pool page, such as Nvidia's. Prints today plots each print on the price line sized by value, Levels shows the biggest prices from the last 10 sessions, Traded today compares the day with a usual day, Buyers and sellers tracks the net by day, and The tape lists every print. The Dark pool prints page does the same across the whole market. The Free plan shows yesterday's session, which is enough to practice this routine. For a guided tour, see how to find dark pool prints and levels on Tradytics.
Common questions
What size of dark pool print is significant?
One that is large next to the stock's own usual day and printed during the session near the market price. A $600M print is about a tenth of a usual SPY day and would be enormous in most mid-caps.
Why do so many prints have the exact same price?
Usually because they were priced at the close. After the bell, trades done at the closing price keep getting reported, so the tape fills with prints at one price, like Nvidia's string of prints at $204.64.
Should I trade off a single dark pool print?
No. A print doesn't show the side, the intent or whether it was one slice of a bigger order. Use prints in aggregate, as levels and size versus a usual day, next to price and options flow.
Why does a print show up hours after the trade?
Some large trades are legitimately reported late with late or out-of-sequence codes. See is dark pool data real time?
Sources
- FINRA Rule 6380A, Transaction Reporting: the 10-second reporting deadline, late designation and after-hours reporting.
- SEC, Regulation of NMS Stock Alternative Trading Systems, Release 34-83663 (July 18, 2018): ATS prices often derived from exchanges, midpoint-only matching, and large orders shredded into smaller ones.
- FINRA, Trade Reporting Facility (TRF): where off-exchange trades in listed stocks are reported.
- Dark pool and block prints on 2026-10-30: 13,984 prints worth $277.16B, $107.38B of it in dark pools.
- Most traded in dark pools and blocks: QQQ ($16.44B), SPY ($14.91B), NVDA ($9.47B), AAPL ($9.03B), MSFT ($6.76B).
Updated 2026-11-02 16:04 UTC