How to find dark pool prints and levels on Tradytics
By Faizan Ahmad. Updated .
Tradytics shows dark pool data in two places. The Darkpools page lists every off-exchange print and every large exchange block across US stocks and ETFs, and each ticker's dark pool research page (for example /research/NVDA/darkpool) shows that stock's prints on its price chart, its dark pool levels, today's dollars against a usual day and the full tape. Dark pool levels are the prices where the most dark pool dollars printed over the last 10 sessions, and they're the main reason to look. Tradytics shows prints within about 15 minutes of their report, so read them for levels, not for timing.
Where are dark pool prints on Tradytics?
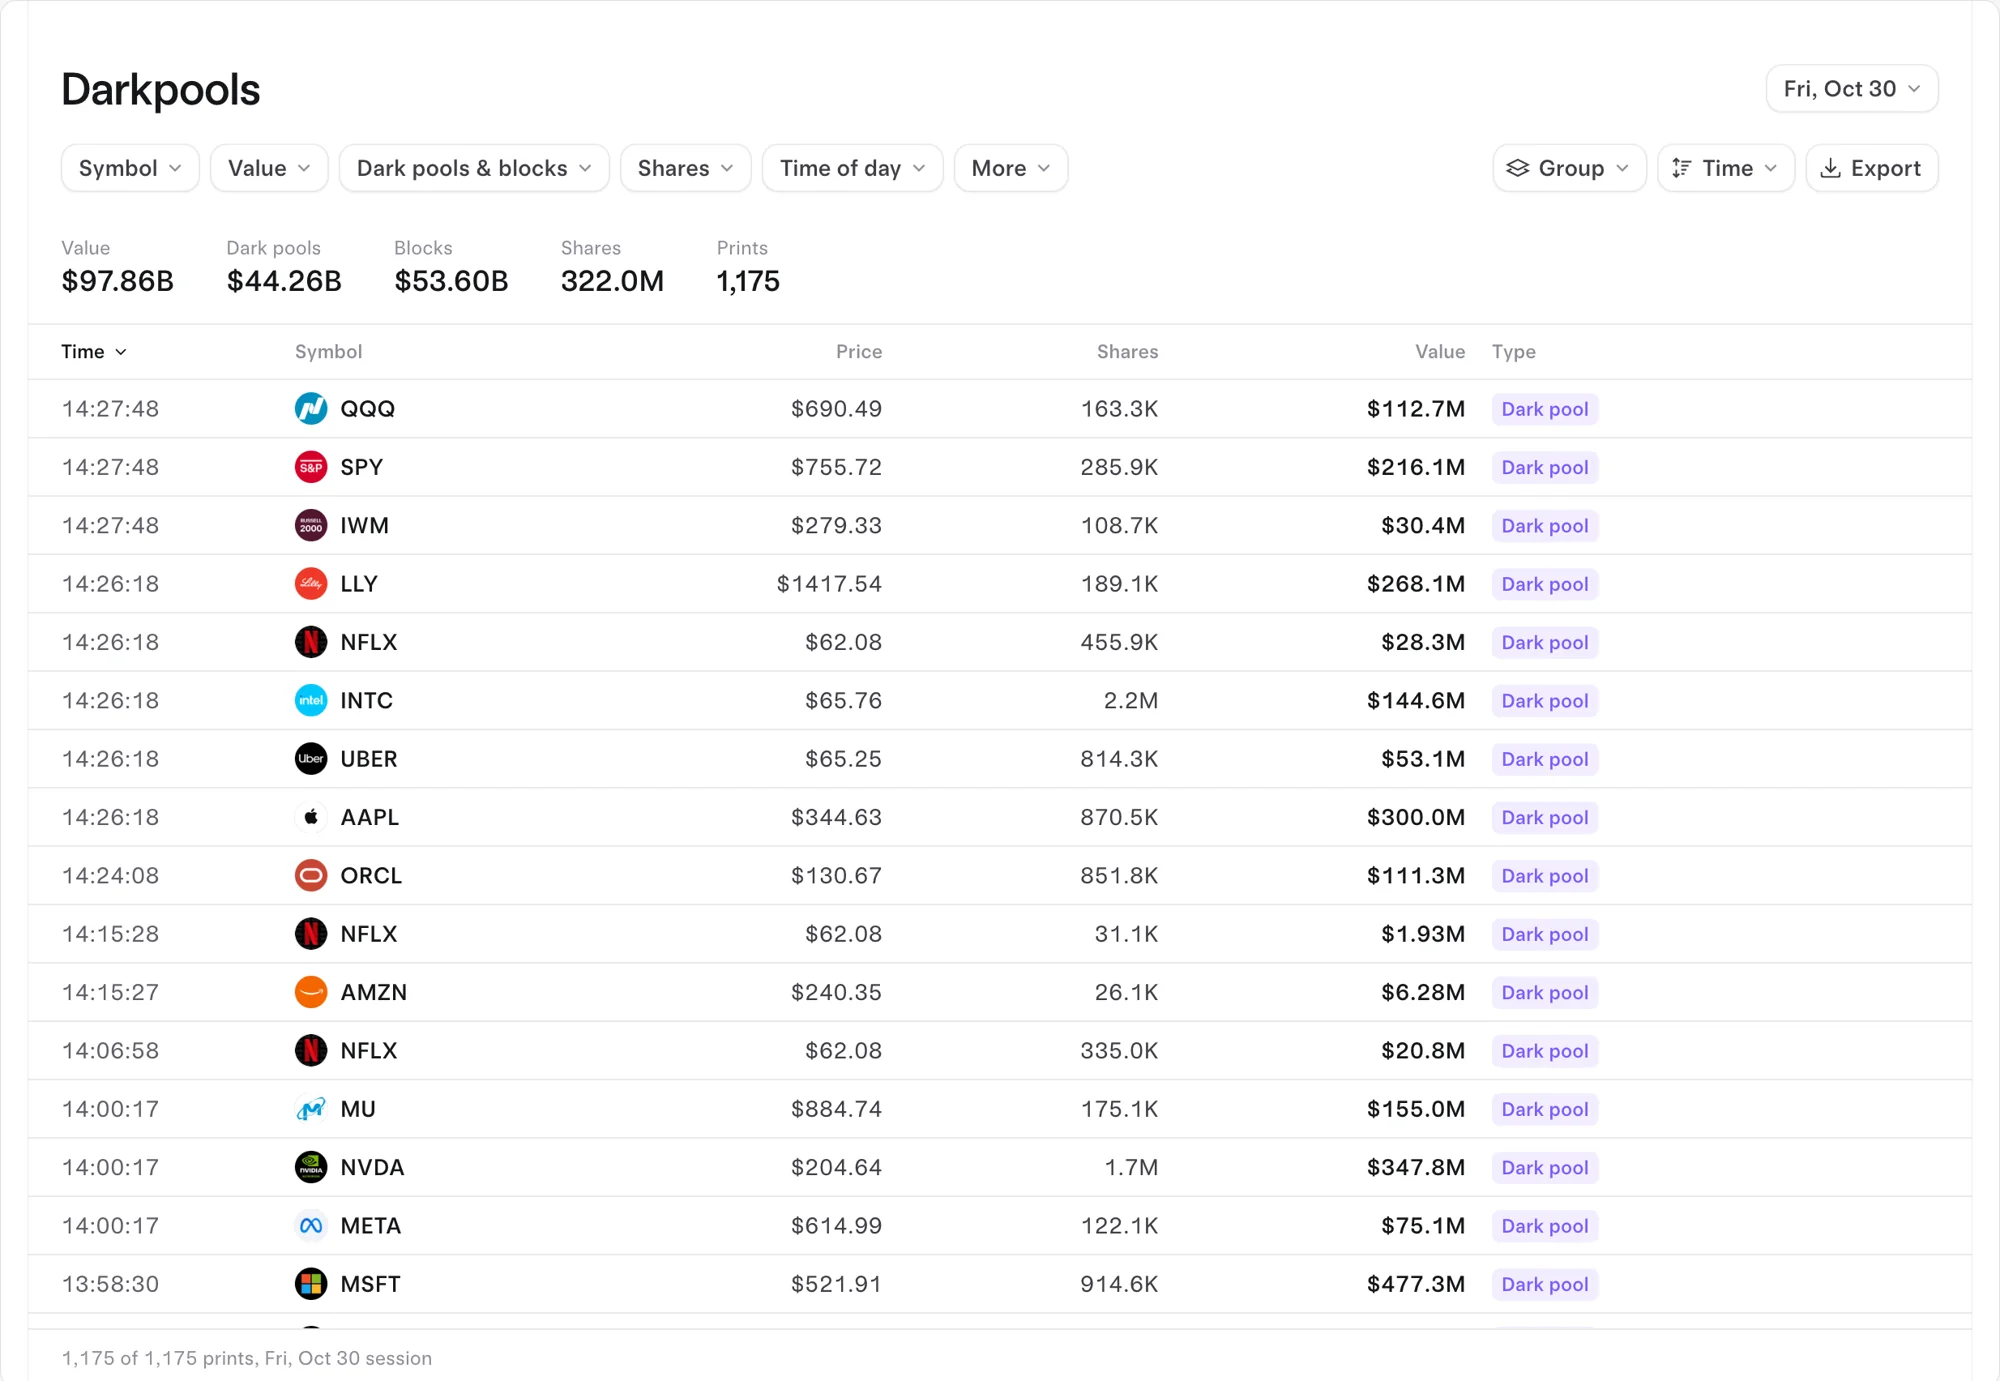
Open Flow, then Darkpools, in the left menu. The page covers two kinds of prints in US stocks and ETFs, about 12,000 a session:
- Every off-exchange print reported to FINRA's trade reporting facilities, labeled "Dark pool".
- Every exchange block of 25,000 or more shares and $250K or more, labeled with the exchange, such as Nasdaq or NYSE Arca.
Totals run across the top (Value, Dark pools, Blocks, Shares, Prints), and each row shows the time, symbol, price, shares, value and type. The filters (Symbol, Value, Dark pools & blocks, Shares, Time of day, More) narrow the list, and Group, the Time sort and Export sit on the right.
How do you find a stock's dark pool levels?
Open the ticker's dark pool research page: search the ticker and choose Darkpool under Research in the left menu, or go straight to /research/NVDA/darkpool (any ticker works in place of NVDA). The page has these sections:
| Section | What it shows | The question it answers |
|---|---|---|
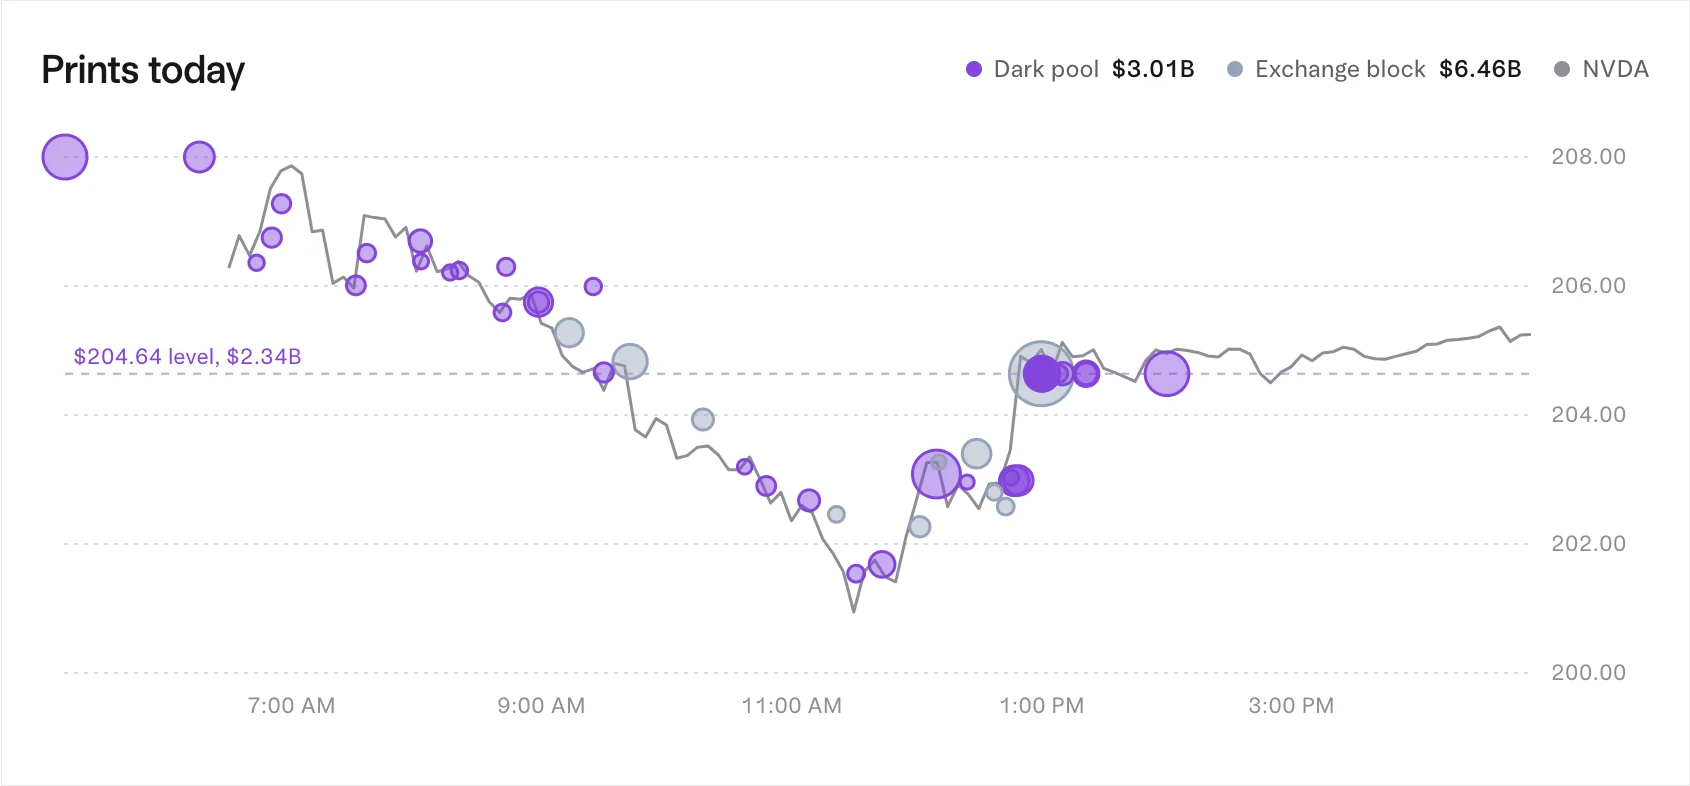
| Prints today | Each print as a bubble on the day's price line, sized by value, with the biggest levels marked | Did big prints land on a level? |
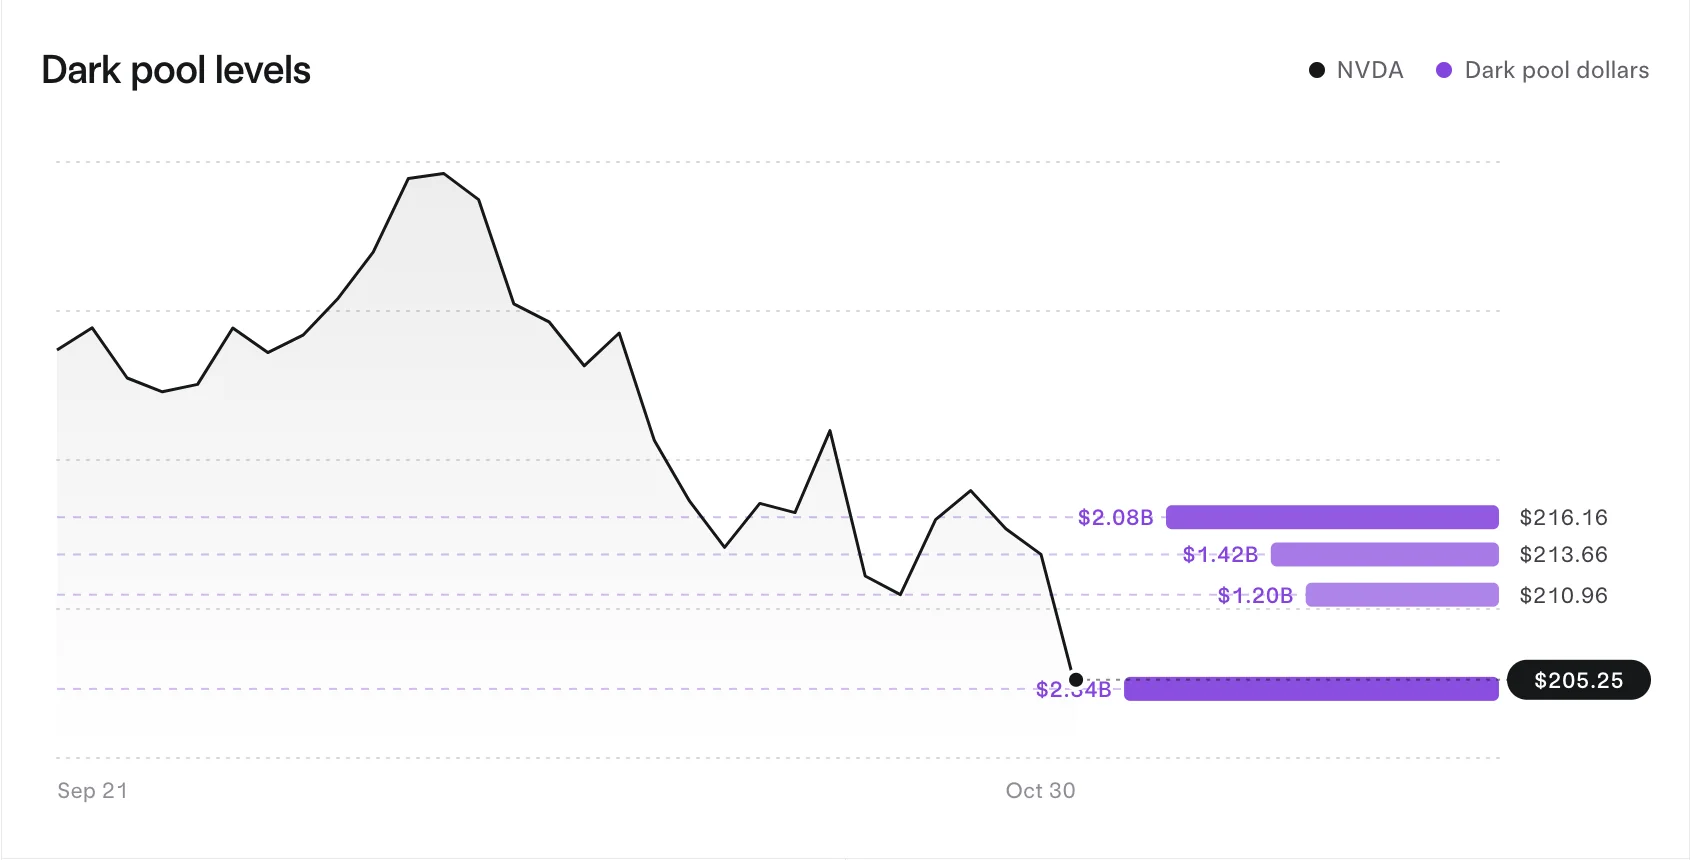
| Levels | The price over the last 10 sessions, with the dark pool dollars at each top level | Where has size changed hands? |
| Traded today | Today's dark pool dollars against each of the last 20 sessions and a usual day | Is today unusual? |
| Buyers and sellers | The buying and selling side of the day's prints | Which side was heavier? |
| The tape | Every print today, newest or largest first, with how far each price is from the price now | Which prints are far from the price, and so likely late? |
Dark pool prints don't say who started a trade, so read any buy or sell split as a lean. Are dark pool prints bullish or bearish? explains why.
Walkthrough: Nvidia's levels on October 30, 2026
On October 30, 2026, Nvidia fell 3.94% to $205.25 in a broad tech sell-off. Its dark pool page told a clear story in three looks.
- Levels. The biggest level of the last 10 sessions was $204.64, with $2.34B in 70 prints, just under the close. The next four were all overhead: $213.66 ($1.42B in 29 prints), $215.35 ($1.38B in 47 prints), $216.16 ($2.08B in 63 prints) and $217.10 ($1.66B in 39 prints). After the drop, Nvidia sat on its biggest level with four more about $7 to $13 above it.
- What the top level is made of. Nvidia had traded well above $204.64 for weeks, so this level formed on the day itself, much of it around the close: the 4:00 PM closing auction on Nasdaq, where 30,459,238 shares ($6.23B) traded as an exchange block, and a 1,699,812-share dark pool print at the same price reported at 5:00 PM. A level built in one session says less than a level that drew prints over many sessions, like $216.16.
- Traded today. A usual day for Nvidia is $4.34B of dark pool dollars. The Traded today card puts the session next to that and the 20 before it, so you can tell a heavy day from a normal one at a glance.
The read: Nvidia closed on its biggest level, with several heavy-trading prices overhead where a bounce would run into old size. Traders who use levels would watch $204.64 as the line to hold and $213.66 as the first area above. That's a map, not a forecast; what are dark pool levels, and do they act as support? covers how far to trust it.
How current is Tradytics dark pool data?
Dark pool prints are after-the-fact reports by nature. Off-exchange trades are reported to FINRA after they execute, and the biggest ones (negotiated blocks, average-price and portfolio trades) are often reported late, sometimes hours later, at a price from earlier in the day, flagged with late or out-of-sequence condition codes. Tradytics shows prints within about 15 minutes of their report. Dark pool data is read for levels (where size accumulated over days), not for the second a print happened, so a 15-minute window changes nothing about the levels, which are built from 10 sessions of prints.
FINRA's rule for its Nasdaq trade reporting facility asks for reports within 10 seconds of execution during market hours and marks anything later with a late modifier, which is why late prints carry a flag in the data.
A real case: on October 30, 2026, a $2.84B SPY print reported at 4:28 PM ET at the prior day's close was a late, previously agreed trade, so ignore its timestamp; its price still marked where size changed hands, right on SPY's biggest level of $769.48 ($20.78B in 155 prints). More in what is a late or out-of-sequence dark pool print?
What does Free show versus Live and Pro?
| Free | Live | Pro | |
|---|---|---|---|
| Price | $0 | $39 a month or $299 a year | $69 a month or $499 a year |
| Darkpools page | Yesterday's session | Today's prints, within about 15 minutes of their report | Today's prints, within about 15 minutes of their report |
| Dark pool research pages | Yesterday's session | Today's session as prints are reported | Today's session as prints are reported |
Because levels are built from 10 sessions, Free is a fair way to map them: nine of the ten sessions behind them are the same either way.
Common questions
Is Tradytics dark pool data real time?
No dark pool data is truly real time, because prints are reports filed after the trade, and big ones often come in late. Tradytics shows prints within about 15 minutes of their report on Live and Pro; Free shows yesterday's session.
What's the difference between a dark pool print and a block on Tradytics?
A dark pool print happened off-exchange and was reported to FINRA. A block is an exchange trade of 25,000 or more shares and $250K or more, such as a closing auction print. See block trades vs dark pool prints.
How are dark pool levels calculated?
They're the prices where the most dark pool dollars printed over the last 10 sessions, ranked by dollar value. Most levels show where size kept trading over days, though one heavy session can build one, as Nvidia's $204.64 level shows.
Why does a print show a price far from where the stock is trading?
Usually because it's a late report of a trade agreed earlier, often at an earlier close. The tape's "Vs. price now" column makes these easy to spot.
Where should a beginner start?
With one ticker's Levels section, not the full market list. How to read dark pool prints walks through the basics.
Sources
- FINRA: Trade Reporting Facility (TRF): the FINRA facilities members use to report trades executed off an exchange.
- FINRA Rule 6380A: trades must be reported as soon as practicable and no later than 10 seconds after execution; later reports carry a late modifier.