Tradytics vs Market Chameleon
By Faizan Ahmad. Updated .
Pick Market Chameleon if your trading starts with research: earnings history, historical option data, spread screeners and downloadable trade files, for $99 a month as of October 2026, with intraday data delayed 15 minutes. Pick Tradytics if you want to see options flow as it prints, along with dark pool prints, dealer gamma and an AI analyst, for $39 a month on Live or free with yesterday's session. If you do both kinds of work, the two fit together: Market Chameleon for earnings and volatility homework, Tradytics for the live tape.
How do Tradytics and Market Chameleon compare?
Both cover US options, but they start from different places. Market Chameleon is a research site: reports, screeners and history you study before a trade. Tradytics is built around what is trading right now, with research pages for every US stock and ETF around it.
| Tradytics | Market Chameleon | |
|---|---|---|
| Paid plans, monthly | Live $39, Pro $69 | Premium $99 |
| Paid plans, yearly | Live $299, Pro $499 | Yearly discount by request (contact them) |
| Free plan | Every page and tool on yesterday's session, no card | Starter: earnings dates for the next 3 business days, large trades of 200 or more contracts for the current day |
| Free trial | None (the Free plan instead) | 7 days, one per person |
| Options flow timing | Live to the second on Live and Pro (OPRA) | Delayed 15 minutes |
| Unusual options activity | Flow page with side, size vs open interest, Vol/OI and an Opening tag | Unusual option volume report and option trade downloads (Premium) |
| Dark pool prints | Within about 15 minutes, with 10-session levels | Not listed |
| Dealer gamma (GEX) | By strike, with call wall, put wall and gamma flip | Not listed |
| Earnings and volatility | Earnings, expected move, IV term structure and smile per stock | Deep history: historical option chains, earnings moves, volatility |
| Screeners | Scanner with 120 signals, updated after the close | Stock, ETF, option, option-trade and spread screeners |
| Data out | API on Pro (50,000 calls a day) | 25 downloads a day on Premium (2 during the trial); custom data feeds sold separately |
| AI | AI analyst: 3, 20 or unlimited questions a day | Not described on its plan pages |
| MCP server | Yes, on Pro | Not listed |
| Your portfolio | Read-only broker linking on every plan | Custom watchlist groups, no broker linking |
| Phone | Web app in the phone's browser | Mobile app not listed |
| Cancelling | Cancel anytime, keep access to the end of the period | Cancel before the next billing cycle; refund policy not stated |
Prices checked October 31, 2026. US list prices from each company's own pages.
Where Market Chameleon wins
Market Chameleon goes deeper into history than Tradytics does, and that matters if you trade earnings or sell premium.
- Earnings and volatility history. Historical option chains, past earnings moves and volatility history are the core of the site. If your question is "how does this stock usually move after earnings compared with what options priced?", Market Chameleon is built for it.
- Screeners for option trades and spreads. Beyond stock and ETF screeners, it has option, option-trade and spread screeners, which suit income and spread traders.
- Downloads. Premium includes 25 downloads a day (2 a day during the trial) for working in a spreadsheet, and custom data feeds are sold separately.
- A trial of the full product. Premium comes with a 7-day free trial, one per person. Tradytics has no trial; its Free plan shows every page on yesterday's session instead.
- Teaching material. An instructional video library and Learn pages.
Where Tradytics wins
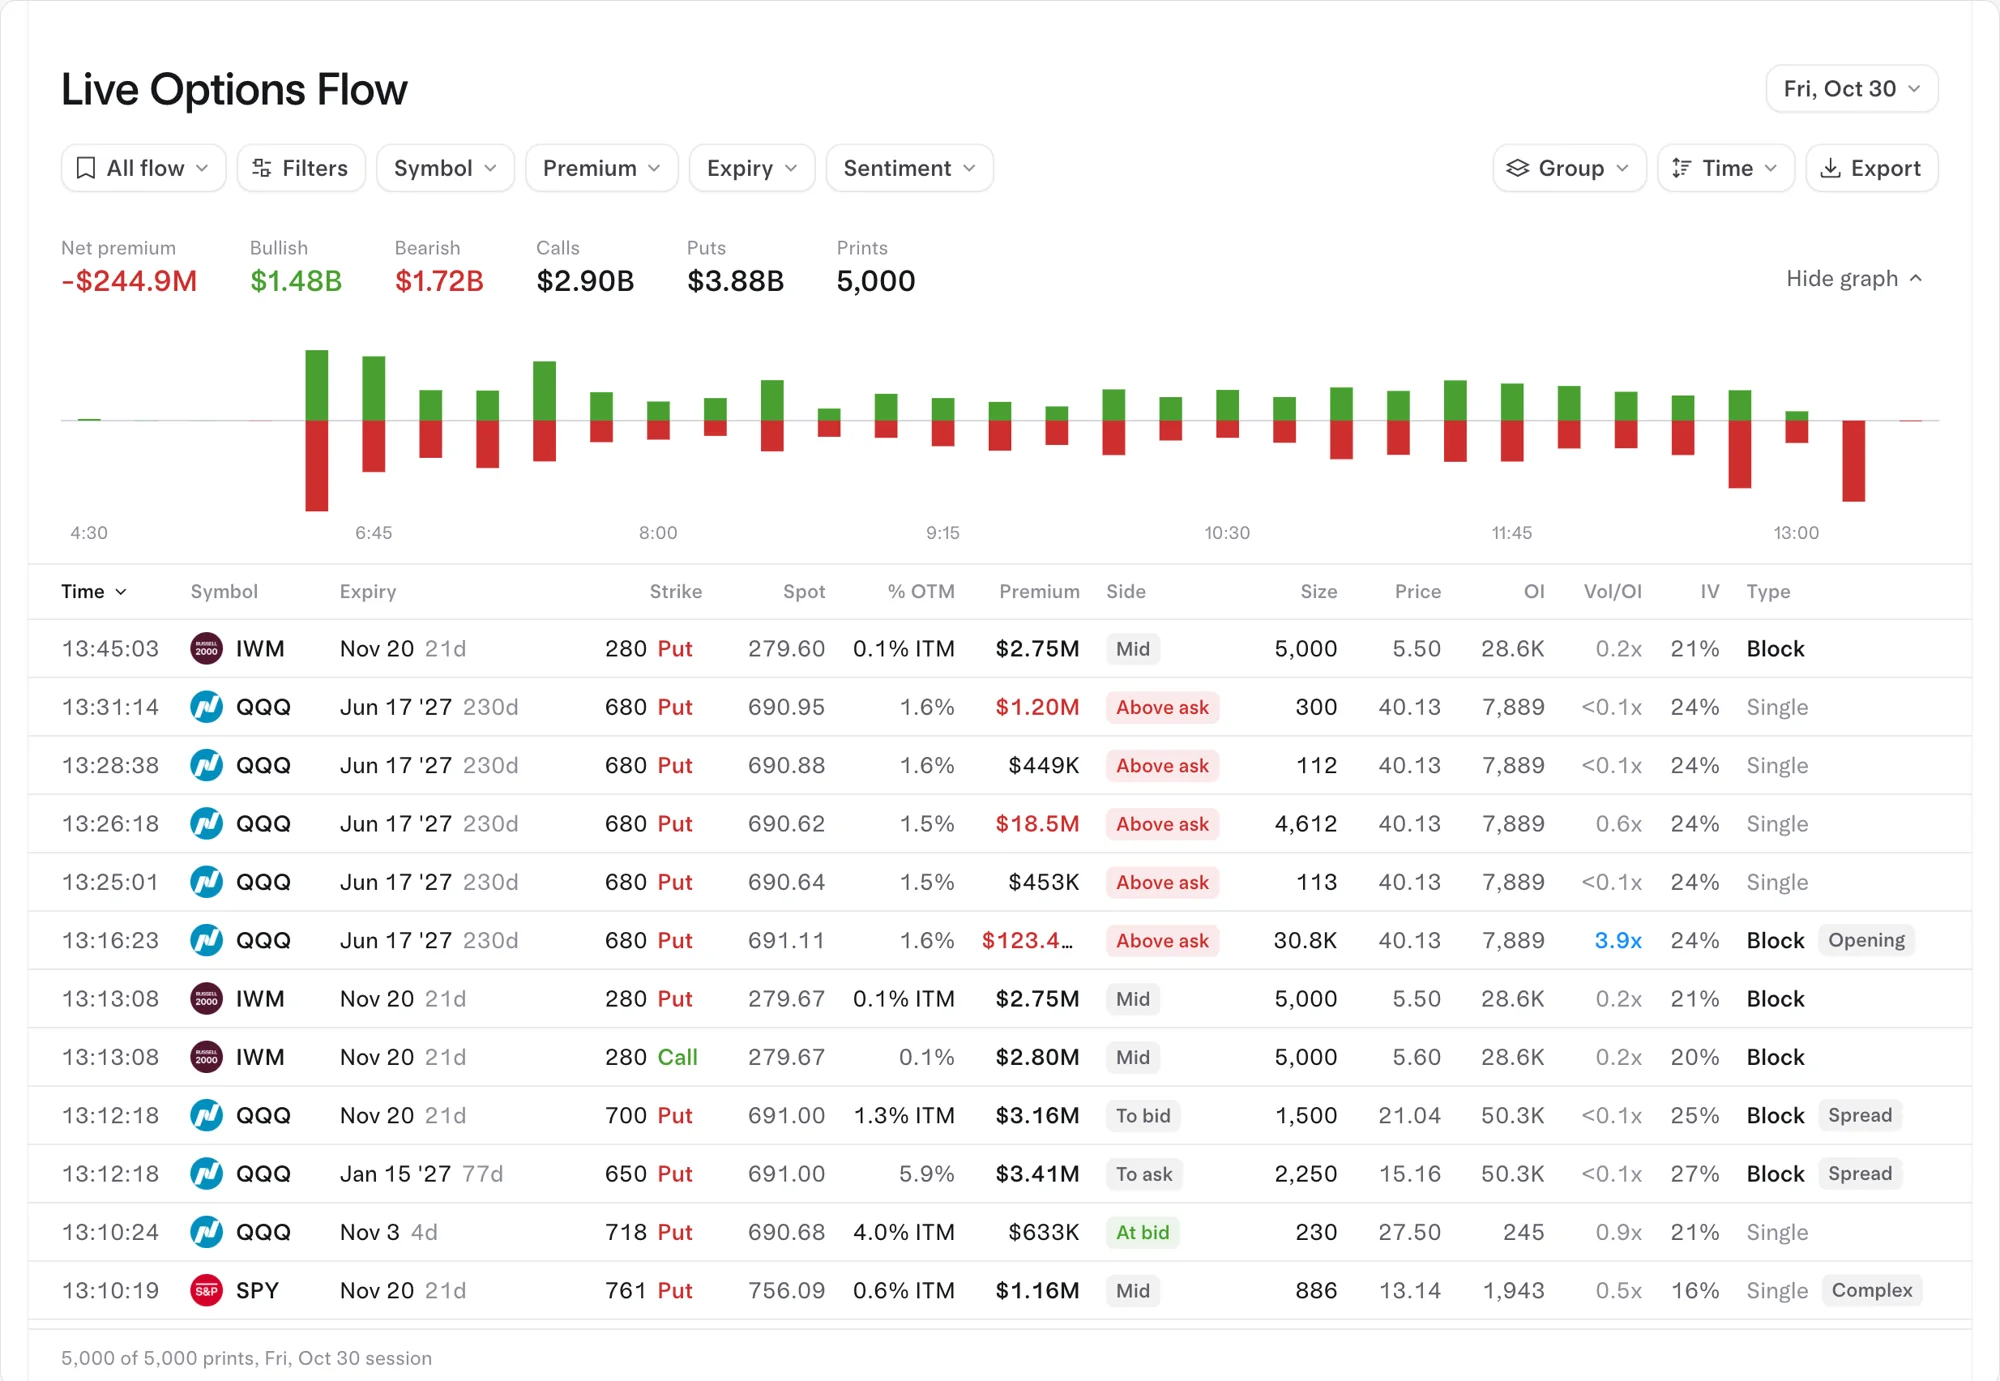
- Live options flow. On Live and Pro, every large print from OPRA, the consolidated options tape, shows up to the second, with the side (above ask, at ask, mid, at bid and so on), size against open interest, Vol/OI, type (sweep, block, split) and an Opening tag when size beats open interest. Market Chameleon's own site says its market data is delayed 15 minutes.
- Dark pool prints and levels. Tradytics shows about 12,000 off-exchange and block prints a session, within about 15 minutes of their report, and builds levels from 10 sessions of prints. Market Chameleon doesn't list dark pool data.
- Dealer gamma. Gamma by strike with the call wall, put wall and gamma flip, on every plan. Not listed on Market Chameleon.
- An AI analyst that does the reading. Ask "What is the options flow saying on NVDA?" and it pulls the flow, builds a table of the biggest trades and tells you whether the largest print looks like a fresh bet or a spread. 3 questions a day on Free, 20 on Live, unlimited on Pro.
- Price. Live is $39 a month or $299 a year, against $99 a month for Market Chameleon Premium.
- Your own portfolio. Read-only broker linking on every plan; Live and Pro add factors, which show whether your return came from skill or from the market.
What a 15-minute delay means on a real trade
On October 30, 2026, at 3:18 PM ET, 5,350 Citigroup (C) December 18 $75 calls were bought at the ask for $24.82M, against open interest of 2,675. In the same minute, 4,270 of the $72.5 calls went at the ask for $20.86M, against open interest of 2,133. Size about twice the open interest means these were most likely new positions. Citigroup ended the day as the most bullish name in the market by net premium ($93.80M of $215.39M traded), even though the stock fell 2.6%.
On the Tradytics live options flow page, those rows appeared at 3:18 PM with their side chip and the Opening tag. On a feed delayed 15 minutes, the earliest you could see them is 3:33 PM, 27 minutes before the close. If you review flow after the bell, that gap costs you nothing. If you act in the last hour, it decides whether you can act at all. Either way, a big call buy is context, not a promise: the stock still closed red that day. For what makes a print like this stand out, see what unusual options activity is.
Earnings: where the two meet
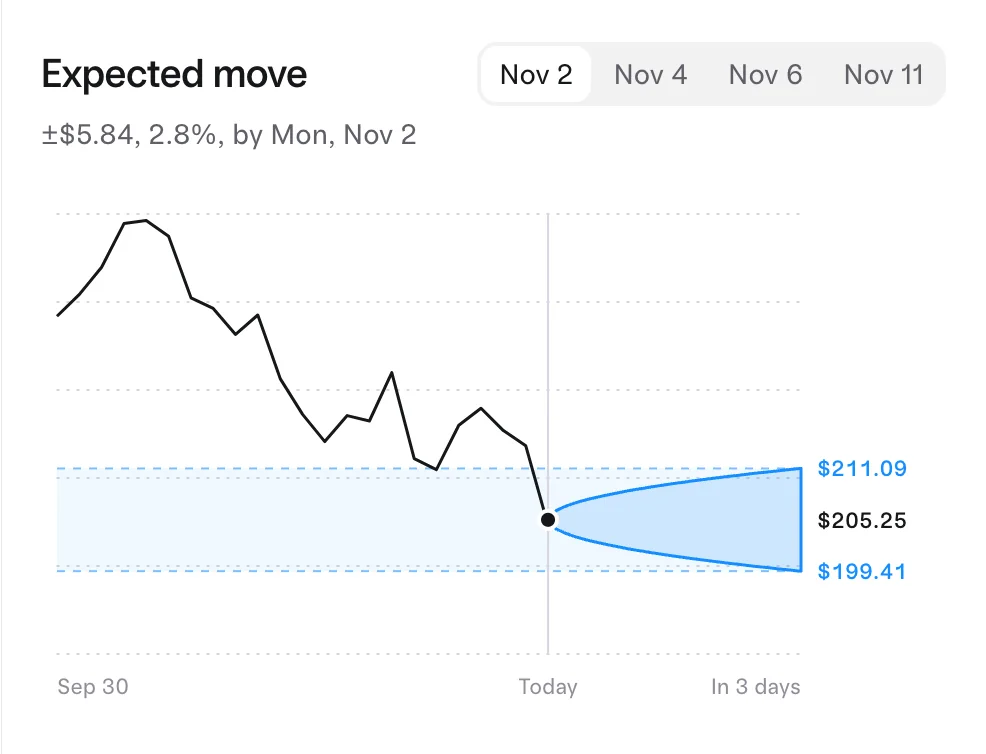
On October 30, 2026, ahead of Apple's earnings report on Monday, AAPL's implied volatility was 42.4%, up 12.3 points on the day, and options priced a move of about $16.49 either way by November 4. The AAPL options page on Tradytics shows that priced move, the IV term structure and smile, and the flow going into the report. Market Chameleon's earnings history is where you check how Apple has actually moved after past reports, and its historical option chains show what options priced back then. Read together, they tell you whether the options look rich or cheap going in, which is the whole question behind IV crush.
Who should choose which
Choose Market Chameleon if:
- You trade earnings and want history on how stocks moved against what options priced.
- You screen for spreads and other option-trade setups and like to work in spreadsheets.
- You plan trades after the close, so a 15-minute delay doesn't matter.
Choose Tradytics if:
- You trade during the session and want flow live to the second.
- You want dark pool levels and dealer gamma next to the flow, not in another subscription.
- You want a plain-words read of what a trade likely is (a hedge, a spread or a fresh bet) from the AI analyst.
- You want to start free: the Free plan shows every page and tool on yesterday's session, no card.
Use both if earnings research is your process but you also act on flow during the day. Market Chameleon Premium plus Tradytics Live is $138 a month at list prices as of October 2026. For how the wider field stacks up, see the best options flow apps in 2026.
Common questions
Is Market Chameleon data real time?
No. Market Chameleon's site says its market data is delayed 15 minutes. Tradytics options flow is live to the second on Live and Pro; the Free plan shows yesterday's session.
Does Market Chameleon have dark pool data?
It isn't listed on its plan pages as of October 2026. Tradytics shows dark pool prints within about 15 minutes of their report, with levels built from the last 10 sessions; here is whether dark pool data can be real time.
Which is cheaper, Tradytics or Market Chameleon?
Tradytics. Live is $39 a month or $299 a year and Pro is $69 a month or $499 a year, against $99 a month for Market Chameleon Premium, whose yearly discount is by request. Both have a free tier. For the full field, see options flow prices side by side.
Does either have a free trial?
Market Chameleon Premium has a 7-day free trial, one per person. Tradytics has no trial; its Free plan is free for good and covers every page on yesterday's session.
Can I download options trade data?
On Market Chameleon Premium, yes: 25 downloads a day. On Tradytics, Pro includes a JSON API (50,000 calls a day) and an MCP server, so you can pull flow and dark pool data into your own code or into Claude and ChatGPT.
Sources
- Market Chameleon: Subscription compare: Premium at $99 a month, the 7-day trial (one per person), download limits and the yearly price by request.
- Market Chameleon: Premium: what Premium includes and the "Market Data Delayed 15 Minutes" notice.
- OPRA (Options Price Reporting Authority): the consolidated last-sale and quote feed from US options exchanges that Tradytics' flow is built on.