How to use options flow for swing trading
By Faizan Ahmad. Updated .
To use options flow for swing trades of a few days to a few weeks, look for stocks where traders are opening new positions in one direction with contracts that expire weeks to a few months out, then time your own entry with the chart and nearby levels. The prints worth following are bought at the ask or sold at the bid, bigger than the contract's open interest, near the money rather than deep in it, and repeated across more than one session. Confirm the next morning that open interest rose, and set your stop from the chart, not from the trade you're following.
What kind of flow matters for a swing trade?
| Look for | Skip | |
|---|---|---|
| Expiry | About two weeks to three months out, enough time for the idea to work | Same-day and same-week contracts |
| Side | Calls bought at or above the ask, or puts sold at the bid (bullish); the reverse for bearish | Mid prints, which have no lean |
| Size vs open interest | Bigger than open interest, so likely a new position | Trades well below open interest, which may be closing |
| Strike | Near the money or out of the money | Deep in the money, which behaves like the stock |
| Repetition | The same name and direction across several sessions | One-off prints |
| Structure | Single legs, or spreads read as one trade | Legs read on their own (see reading spreads) |
The strike rule has evidence behind it. In a study of CBOE data from 1990 to 2001, Jun Pan and Allen Poteshman found that option volume in deep out-of-the-money contracts, the most leveraged ones, carried the most information about the next day's stock returns, while in-the-money contracts carried very little.
A real example: Nvidia's January puts on October 30, 2026
In under an hour on October 30, 2026, three large prints hit the same Nvidia contract, the January 15, 2027 $170 put:
| Time (ET) | Contracts | Premium | NVDA price |
|---|---|---|---|
| 1:06 PM | 12,205 | $4.81M | $203.815 |
| 1:07 PM | 15,662 | $6.26M | $203.535 |
| 1:55 PM | 13,344 | $5.34M | $202.62 |
That's 41,211 contracts and $16.41M against open interest of 45,760, so in less than an hour nearly as many contracts traded as existed that morning. The contract fits a swing horizon: 77 days to expiry and about 16% below the price, cheap enough at roughly $4 a share to be either a bearish bet or portfolio protection. Nvidia fell 3.9% that day.
Here is how a swing trader would work it. First, the side of each print: bought at the ask, sold at the bid, or both, which would mean positions changing hands. Second, the next morning's open interest. If it jumped well above 45,760, new positions stayed open. If it barely moved or fell, the volume was mostly traders closing or passing contracts back and forth. Third, the chart: is Nvidia sitting on a level that a bearish swing could lean against? Only if all three line up is there a setup, and even then the puts may be a hedge for someone who owns a lot of Nvidia stock.
Deep in-the-money prints need extra care. The same day, Citigroup's December 18 $75 calls traded 5,350 contracts against open interest of 2,675, bought at the ask, for $24.82M. On paper that passes every test. But those calls cost about $46 a share on a $75 strike, so the stock was far above the strike and the calls move almost one for one with it: closer to buying shares than to a leveraged bet, and weaker evidence of conviction.
Why does repeat activity beat one big print?
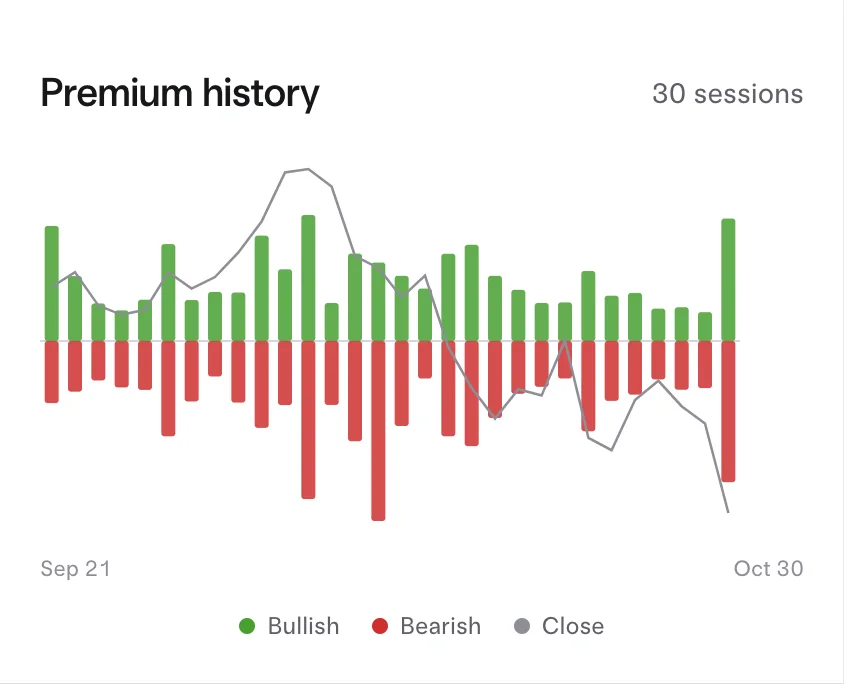
A single print can be a hedge, a roll or someone closing out, and you usually can't tell which. The same direction in the same name across three or four sessions is much harder to explain away. Look for buying that keeps coming at similar strikes and expiries, or traders rolling up to higher strikes as the stock moves their way. A 30-session premium history makes this visible at a glance: one tall bar is an event, a run of bars is a position being built.
How long does flow matter, according to research?
Not long. In Pan and Poteshman's data, the predictive power of opening option purchases was strongest over the next day and week and faded over the following several weeks, as the information worked its way into the stock price. That signal came from a dataset that recorded whether each trade opened a new position, which the public tape doesn't show. For a swing trader, two things follow: expect any edge from flow to play out over days, not months, and treat the next-morning open interest check as the closest thing you have to that missing opening-or-closing flag.
A simple swing trading routine with options flow
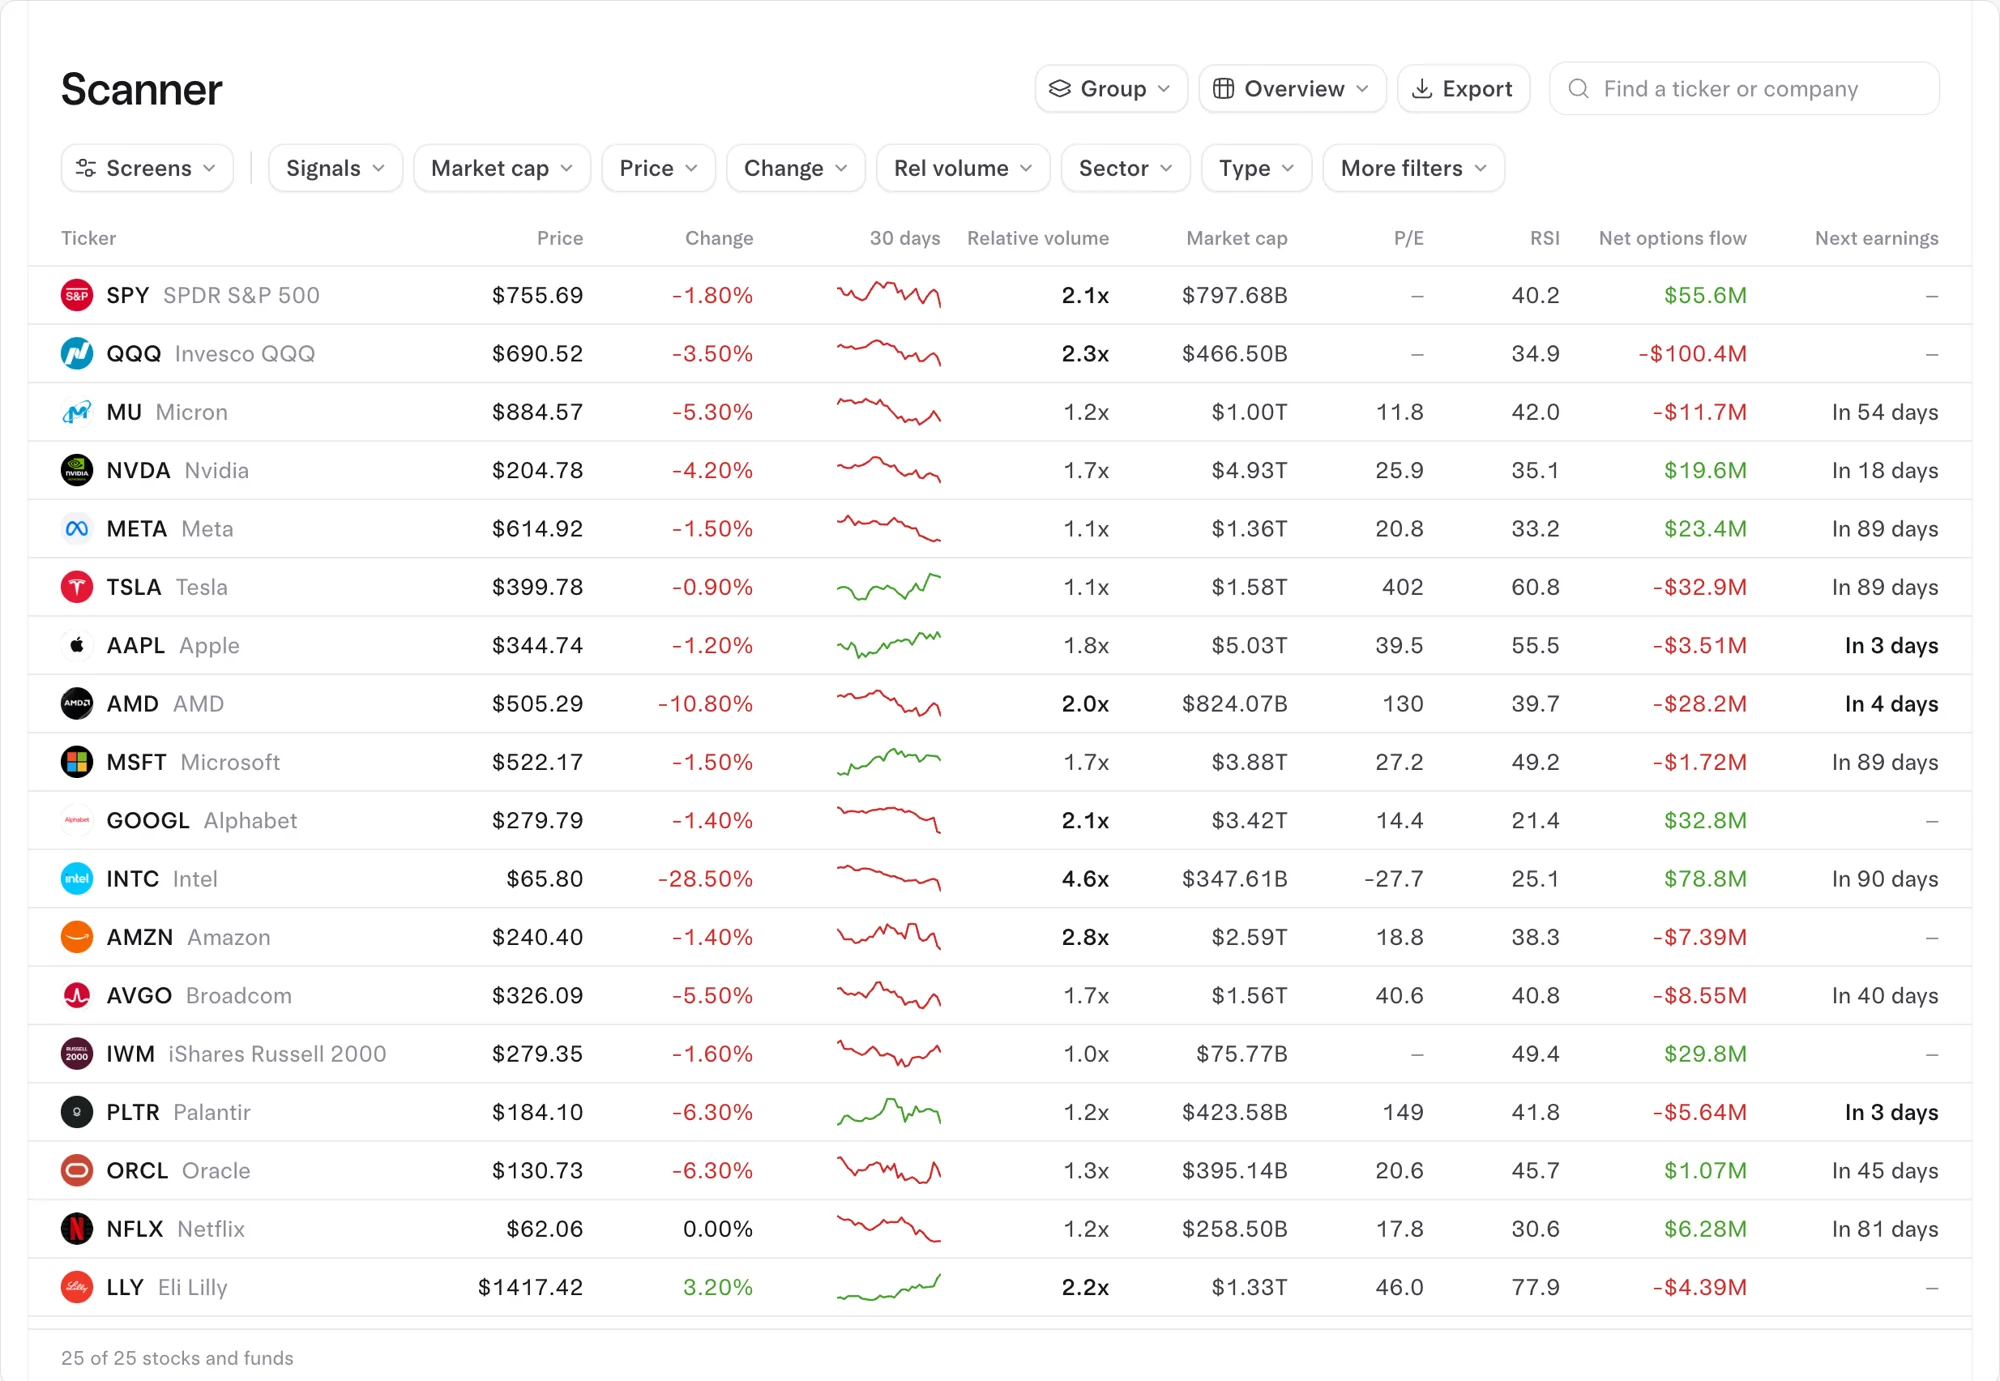
- Run the scanner's bullish flow screen, or start from the most bullish and bearish names by net premium.
- Open each name's options page: premium history, bets by strike and expiry, and the largest and unusual orders.
- Drop spreads, deep in-the-money prints, obvious hedges and anything expiring this week.
- Next morning, check whether open interest rose on the contracts you care about (see volume vs open interest).
- Find your levels: dealer call and put walls, dark pool levels and the chart's own support and resistance.
- Pick your own expiry and size. The trader you're following may be hedged elsewhere, may have a different deadline, and can afford to be wrong in ways you can't.
How to see it on Tradytics
The scanner runs 120 signals on every US stock and ETF, including options flow and dark pool signals and one-click screens such as bullish flow, and updates after the close at 4:05, 6:05 and 8:10 PM ET. Each research options page, like NVDA options, has premium history for 30 sessions, where the money went, bets by strike and expiry, and the largest and unusual orders, and the dark pool page beside it shows the levels from the last 10 sessions. Free shows yesterday's session, which works for a routine you run before the next open; Live shows today's flow as it prints.
Common questions
What expiry should a swing trader follow?
Contracts with roughly two weeks to three months left fit most swing trades. Same-week contracts are mostly noise, and long-dated LEAPS are often stock substitutes; short-dated vs LEAPS flow explains the difference.
Should I buy the same contract the big trader bought?
Not by default. Their contract fits their horizon, their hedges and their account. Use their trade to pick the stock and direction, then choose an expiry and strike that fit your own plan and risk.
How long after unusual flow does a stock usually move?
When there is an effect at all, research points to days, not months. Many large prints are followed by nothing, because they were hedges or the trader was wrong.
Is free or delayed flow good enough for swing trading?
Usually, yes. Swing setups are planned after the close and confirmed the next morning, so seeing the previous session in full matters more than seeing it to the second.
Sources
- Pan and Poteshman, "The Information of Option Volume for Future Stock Prices," NBER Working Paper 10925 (2004): uses CBOE volume from opening purchases, 1990 to 2001; predictability is greatest for deep out-of-the-money contracts and gradually dies out over several weeks.
- OPRA Binary Data Recipient Interface Specification (version 6.4b, August 25, 2026): open interest messages are sent once a day, at about 6:30 a.m. ET, which is why opening positions are confirmed the next morning.
- Most bullish options flow on 2026-11-02: MRVL ($22.86M net), AMZN ($15.80M net), TSLA ($12.08M net), LITE ($6.09M net), PLTR ($4.32M net).
- Most bearish options flow on 2026-11-02: AAPL ($40.91M net), AMD ($20.30M net), MU ($10.61M net), ORCL ($7.99M net), NVDA ($7.77M net).
Updated 2026-11-02 16:05 UTC