What is a golden sweep?
By Faizan Ahmad. Updated .
A golden sweep is a label some options flow platforms give to a large sweep, usually $1M or more in premium, filled at or above the ask. It's a vendor term, not an exchange or regulatory one, so the exact cutoff varies from tool to tool. It flags a big, urgent buy. It doesn't tell you whether the buyer opened a new bet, closed an old short, bought protection, or placed one leg of a spread.
What makes a sweep "golden"
The label stacks three filters on one trade:
- It's a sweep. One order took the best prices on several exchanges at the same moment, using an intermarket sweep order. That's a choice of speed over price (see what is an options sweep).
- It filled at or above the ask. The buyer paid the seller's price, or more, rather than waiting at the mid. That marks the buyer as the aggressive side.
- It's big. Usually $1M or more in premium. Some tools use other cutoffs.
Put together, the label says: someone spent at least $1M and was in a hurry to buy. For calls, that reads bullish. For puts, it reads bearish or as a hedge.
Why traders watch golden sweeps
Urgency plus size is rare. Paying the ask on every exchange costs more than resting an order, and doing it with $1M or more means a buyer who cared about getting filled now. When a move follows, these are the trades people screenshot. That's also the problem: you only hear about the ones that worked.
Where the label misleads
Every part of the definition checks how the trade filled. None of it checks what the trade is. Two real trades from October 30, 2026 show the gap. Neither was labeled a sweep, but both would pass the premium-and-side half of the test, and that half is where the trouble lies.
- A "bullish" call that was mostly stock. At 3:18 PM, 5,350 Citigroup (C) December 18 75 calls were bought at the ask for $24.82M, double the open interest of 2,675. Big, aggressive, opening. But that's about $46.39 a share for a $75 strike, so the calls were deep in the money. The 72.5 calls bought in the same minute cost about $48.85, almost exactly $2.50 more for a strike $2.50 lower, which is how options trade when they move nearly one for one with the stock. Most of that premium is stock value: closer to buying shares than a bet on a big move. Those two trades alone were $45.68M of bullish premium, and C finished the day as the market's most bullish name by net premium ($93.80M).
- A "bullish" call that was probably half a spread. 4,481 Meta February 19, 2027 730 calls were bought at the ask for $10.59M at 1:03 PM. In the same minute, 4,481 Meta February 19, 2027 780 calls traded for $6.60M. Same size, same expiry: that usually means a call spread, where selling the 780 caps the upside. A screen that only checks premium and side flags the 730 leg and ignores the 780 leg.
Two more blind spots: a trader buying back calls they sold earlier sweeps the ask exactly like a new buyer, and a fixed dollar cutoff treats very different stocks the same. On October 30, 2026, SPY traded $1.57B in options premium, so $1M there is routine. Across the whole market that day, the average large print was about $332K ($24.56B over 73,896 prints).
What the label tells you, and what it doesn't
| The label tells you | The label doesn't tell you |
|---|---|
| The order filled across several exchanges at once | Whether it opened a position or closed one |
| The buyer paid the ask or more | Whether it was a bet, a hedge or a spread leg |
| At least about $1M changed hands | Whether $1M is big for that stock |
| Someone wanted it filled now | Whether the premium was mostly stock value (deep in the money) |
A better filter than "golden"
Keep the useful parts (sweep, aggressive side, real money) and add the checks the label skips:
- Size bigger than open interest, so at least part of it has to be new.
- No partner print in the same minute at another strike, and no Spread or Complex tag.
- Premium that's large for that stock, not a fixed $1M. Compare it with the stock's usual daily options premium.
- Out of the money and near-dated if you're looking for a directional bet. Deep in-the-money premium is mostly stock exposure (see premium vs contracts).
- Repeat buying in the same contract or expiry across the day.
How to filter options flow walks through this order of filters step by step.
How to see it on Tradytics
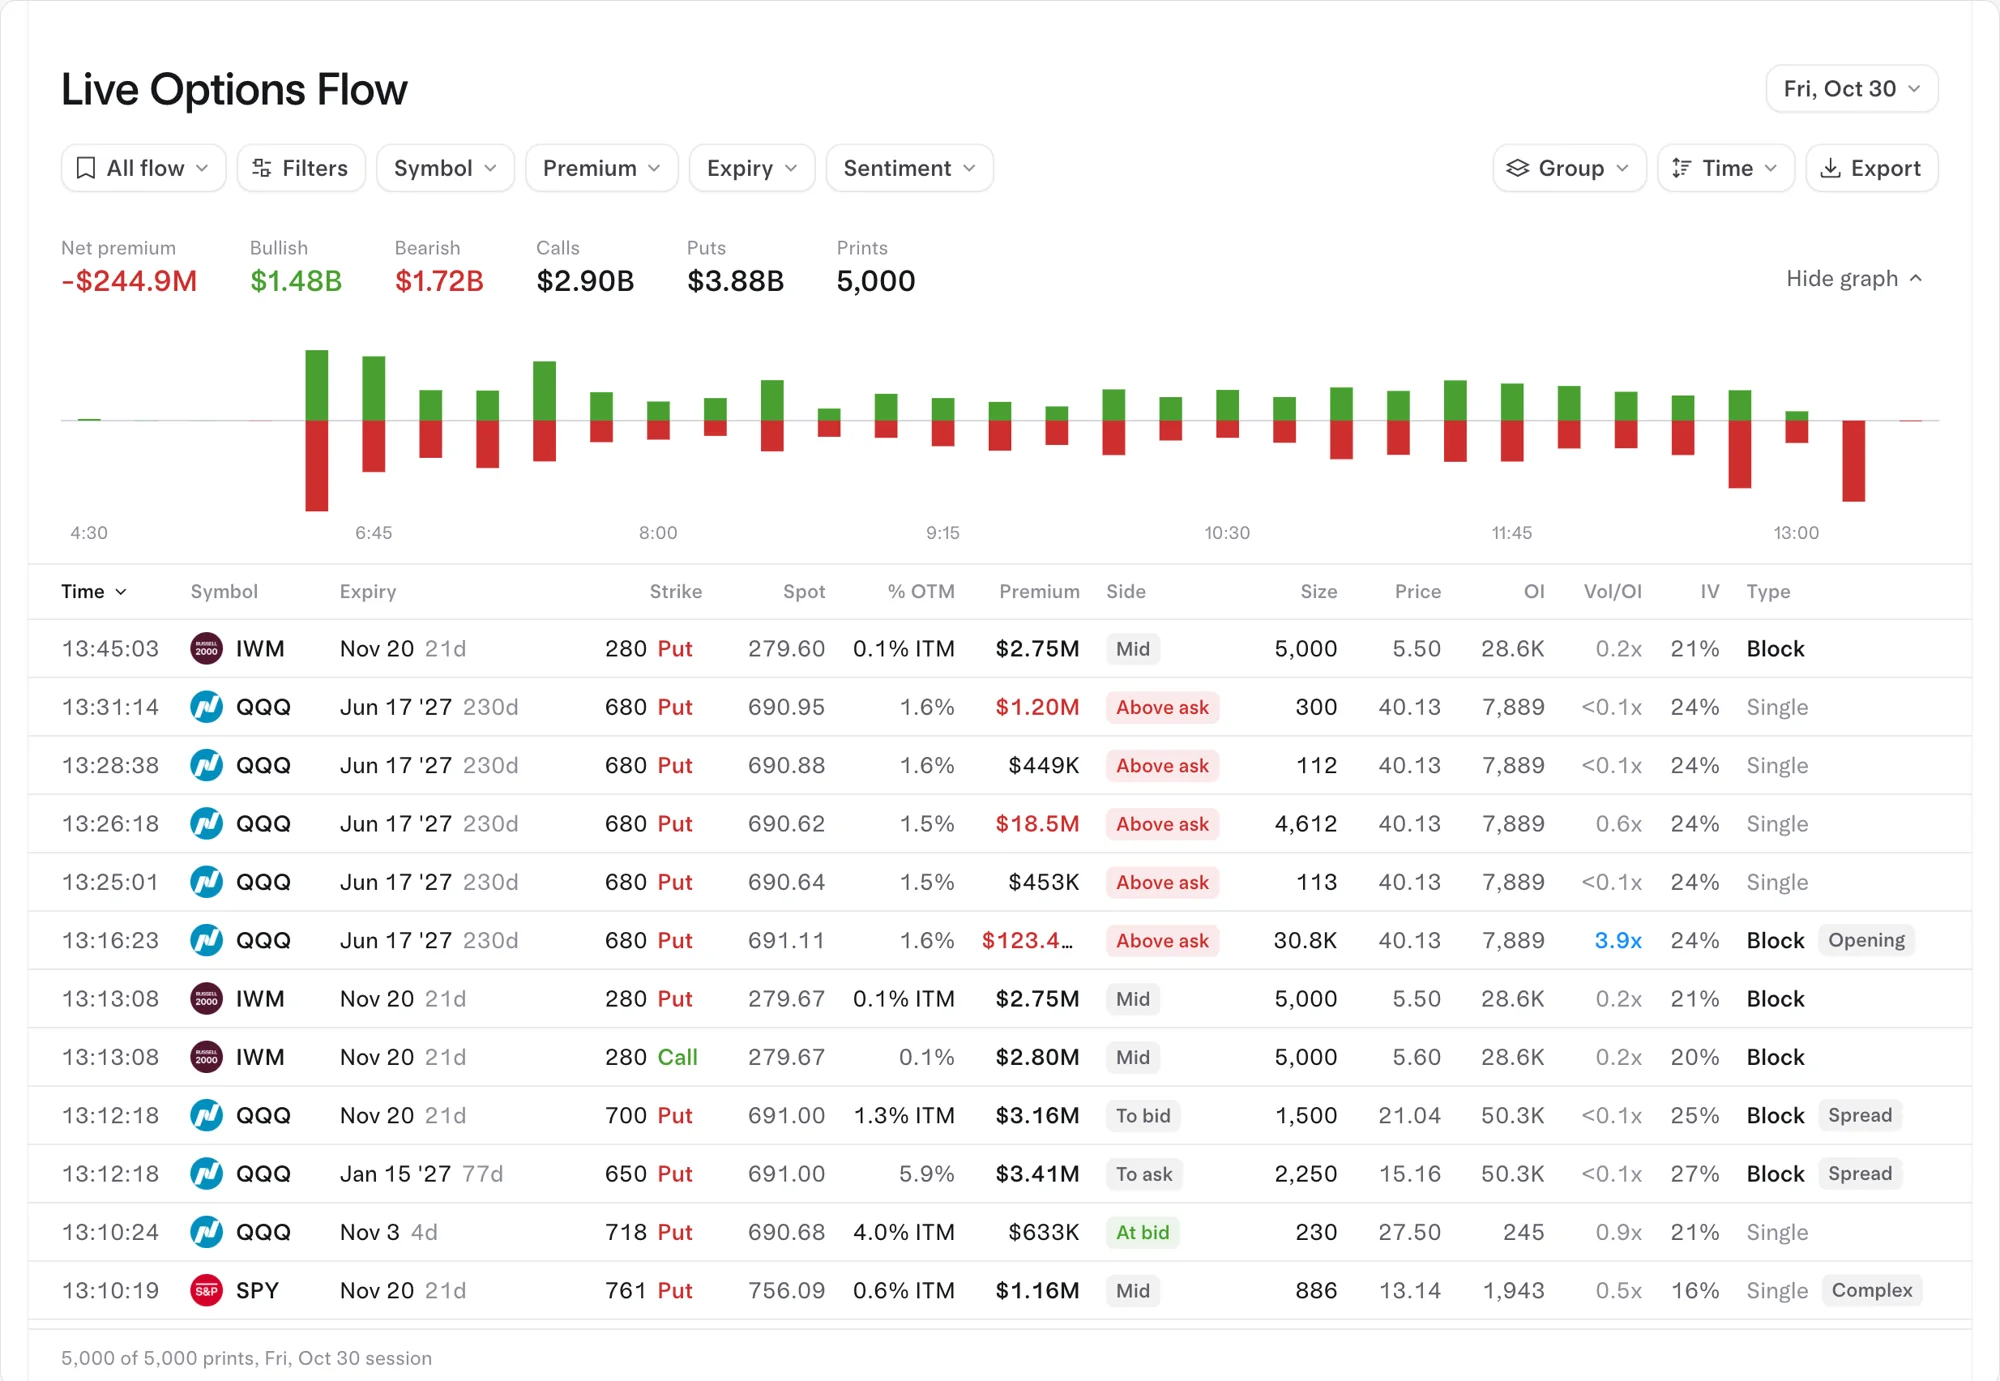
You don't need the label. On the Live options flow page, every print shows the three parts in separate columns: Type (Sweep), Side (At ask or Above ask) and Premium. The same row also shows size, open interest, Vol/OI, % OTM and tags like Opening and Spread, so you can run the better filter above on one line. Live and Pro are live to the second; Free shows yesterday's session.
Common questions
Is a golden sweep bullish?
A golden sweep in calls leans bullish. One in puts leans bearish or is protection for stock someone owns. Either way it's one trader's position, not a forecast.
Is $1M the official threshold?
No. There's no exchange or regulatory definition of a golden sweep. $1M is a common vendor cutoff, and some tools use different numbers.
Do golden sweeps predict price moves?
Not reliably. Some are followed by big moves, many aren't, and the winners are the ones that get shared. Does following unusual options activity work? covers what flow can and can't tell you.
What's the difference between a golden sweep and a block?
A golden sweep is urgent, filled across exchanges at the ask. A block is one large print, usually negotiated and often at the mid. See sweep vs block vs split.
Sources
- Options Order Protection and Locked/Crossed Market Plan (2009), Section 2 definition of an intermarket sweep order, the order type behind every sweep.
- OPRA, the consolidated options tape that flow tools read sweeps from.
- Options Industry Council: Bull Call Spread, how selling a higher-strike call caps a call buyer's gain.
- Options Industry Council: General Information FAQ, why open interest depends on whether each side is opening or closing.
- Most bullish options flow on 2026-11-02: MRVL ($23.05M net), AMZN ($16.54M net), TSLA ($12.03M net), LITE ($6.09M net), PLTR ($4.19M net).
- Most bearish options flow on 2026-11-02: AAPL ($40.91M net), AMD ($20.30M net), MU ($10.45M net), ORCL ($7.77M net), NVDA ($7.76M net).
Updated 2026-11-02 16:05 UTC