How to filter options flow and cut the noise
By Faizan Ahmad. Updated .
To cut options flow down to trades worth reading, filter in this order: a premium floor sized to the stock, an aggressive side (at or above the ask for buyers, at or below the bid for sellers), size bigger than open interest, an expiry window that fits your timeframe, and no spreads or multi-leg trades. Then group what's left by ticker and look for repeat buying. Filters remove noise. They don't turn a print into a signal, so every trade that survives still needs a second look.
Why options flow needs filtering
On October 30, 2026, the market printed 73,896 large options trades: $11.84B in calls and $12.72B in puts. Much of that is not someone betting on a stock. It's funds hedging, market makers adjusting risk, traders rolling positions, spreads where one leg cancels the other, and people closing trades they opened weeks ago. A raw flow feed shows all of it with the same weight. Filters are how you get from tens of thousands of prints to a few dozen you can actually think about.
The filters that matter, in order
1. Set a premium floor that fits the stock
Filter by premium (contracts x price x 100), not contract count, because cheap contracts inflate counts (see premium vs contracts). Size the floor to the stock: on October 30, NVDA options traded $1.18B in premium and Microsoft's traded $76.34M, so one dollar line can't fit both. A higher floor for index ETFs and mega caps, a lower one for quieter names.
2. Keep the aggressive side, drop the mid
Keep prints at or above the ask (the buyer paid up) and at or below the bid (the seller hit the bid). Mid prints have no clear lean, and many are negotiated trades or spread legs. Then combine side with type: calls bought and puts sold lean bullish; puts bought and calls sold lean bearish.
3. Require size bigger than open interest
Open interest is the number of contracts open after the last close. If a trade's size beats it, at least part of the trade has to be new positions rather than old ones closing. This is the single best filter against closing trades. Why it works, and where it doesn't, is in volume vs open interest.
4. Pick an expiry window that matches your timeframe
A swing trader doesn't need same-day options, which are dominated by intraday trading and hedging (see what are 0DTE options). Contracts dated years out are often stock replacement or hedges. Choose the window you'd actually trade.
5. Choose moneyness on purpose
Out-of-the-money contracts are where directional bets live. Deep in-the-money contracts are mostly intrinsic value and behave like stock, so they inflate premium without being bold bets. Use % OTM to keep one or the other.
6. Drop spreads and multi-leg trades
One leg of a spread looks like a big directional bet; the other leg cancels much of it. Remove prints tagged Spread or Complex, then watch for same-size prints in the same minute that slipped through. See how to read spreads.
7. Decide what to do with index and ETF flow
Index and ETF options are where much of the market's hedging happens. On October 30, the put/call ratio by premium was 1.26 in index options against 0.91 in single stocks, and 2.26 in SPY. If you're hunting single-stock bets, filter them out. If you want to read market fear, look at them on their own.
What each filter removes, and what it can wrongly remove
| Filter | Removes | Can wrongly remove or keep |
|---|---|---|
| Premium floor | Small, cheap trades | Real bets in quiet stocks if the floor is set for mega caps |
| Aggressive side only | Mid prints, negotiated trades | Big blocks that were real bets but printed at the mid |
| Size above open interest | Most closing trades | New positions in contracts with large open interest |
| Expiry window | Same-day noise or long-dated hedges | Swing bets just outside the window |
| Out of the money only | Stock replacement and deep in-the-money trades | Deep in-the-money bets that are directional |
| No spreads | Tagged multi-leg trades | Spread legs that printed separately and weren't tagged |
| Sweeps only | Blocks, splits and singles | Most of the biggest trades, which print as blocks or singles |
That last row is a common mistake. On October 30, 2026, none of the eight biggest prints by premium was a sweep: three were blocks and five were singles. A sweeps-only filter would have hidden all of them.
What a filtered list looked like on October 30, 2026
Run the "size bigger than open interest" filter on that day and you get a short list of unusual bets. A few of them show why the filtered list still needs reading:
- Citigroup (C) pulled both ways. At 3:18 PM, two December 18 call trades were bought at the ask: 5,350 of the 75 strike ($24.82M) and 4,270 of the 72.5 strike ($20.86M). Bullish. But at 3:05 PM, 1,000 December 18 50 calls were sold at the bid ($7.12M), against open interest of only 107. Bearish. Grouping by ticker shows the mix that single rows hide. All three strikes were deep in the money, so this is closer to stock trading than to bets on a big move.
- Meta's call had a partner. 4,481 February 19, 2027 730 calls were bought at the ask for $10.59M against open interest of 793. In the same minute, 4,481 of the 780 calls traded for $6.60M. Likely a call spread, which would cap the upside at $780.
- Seagate (STX) was cleaner. 1,621 November 20 655 puts were sold at the bid for $8.71M against open interest of 70. Aggressive side, far above open interest, no partner on the list. That's what a trade that survives every filter looks like, and it's still one trader's view.
Then look for repeat buying
One print is an anecdote. Several prints in the same contract are a pattern. On October 30, the NVDA January 15, 2027 170 put printed three times in size: 12,205 contracts, then 15,662, then 13,344, for $16.41M in all. Grouped by contract, three medium rows become one large position worth a closer look, even though no single print stood out on its own.
Mistakes that make filters worse
- One dollar threshold for every stock. It drowns you in SPY and hides small caps.
- Trusting labels over checks. "Sweep" and "block" describe how a trade filled, not what it means.
- Chasing what already moved. Some big trades are reactions to a move, not causes of it. See why options flow alerts seem late.
- Treating survivors as signals. A filter finds candidates. Your reasons to trade still have to come from the chart, the levels and the setup.
How to see it on Tradytics
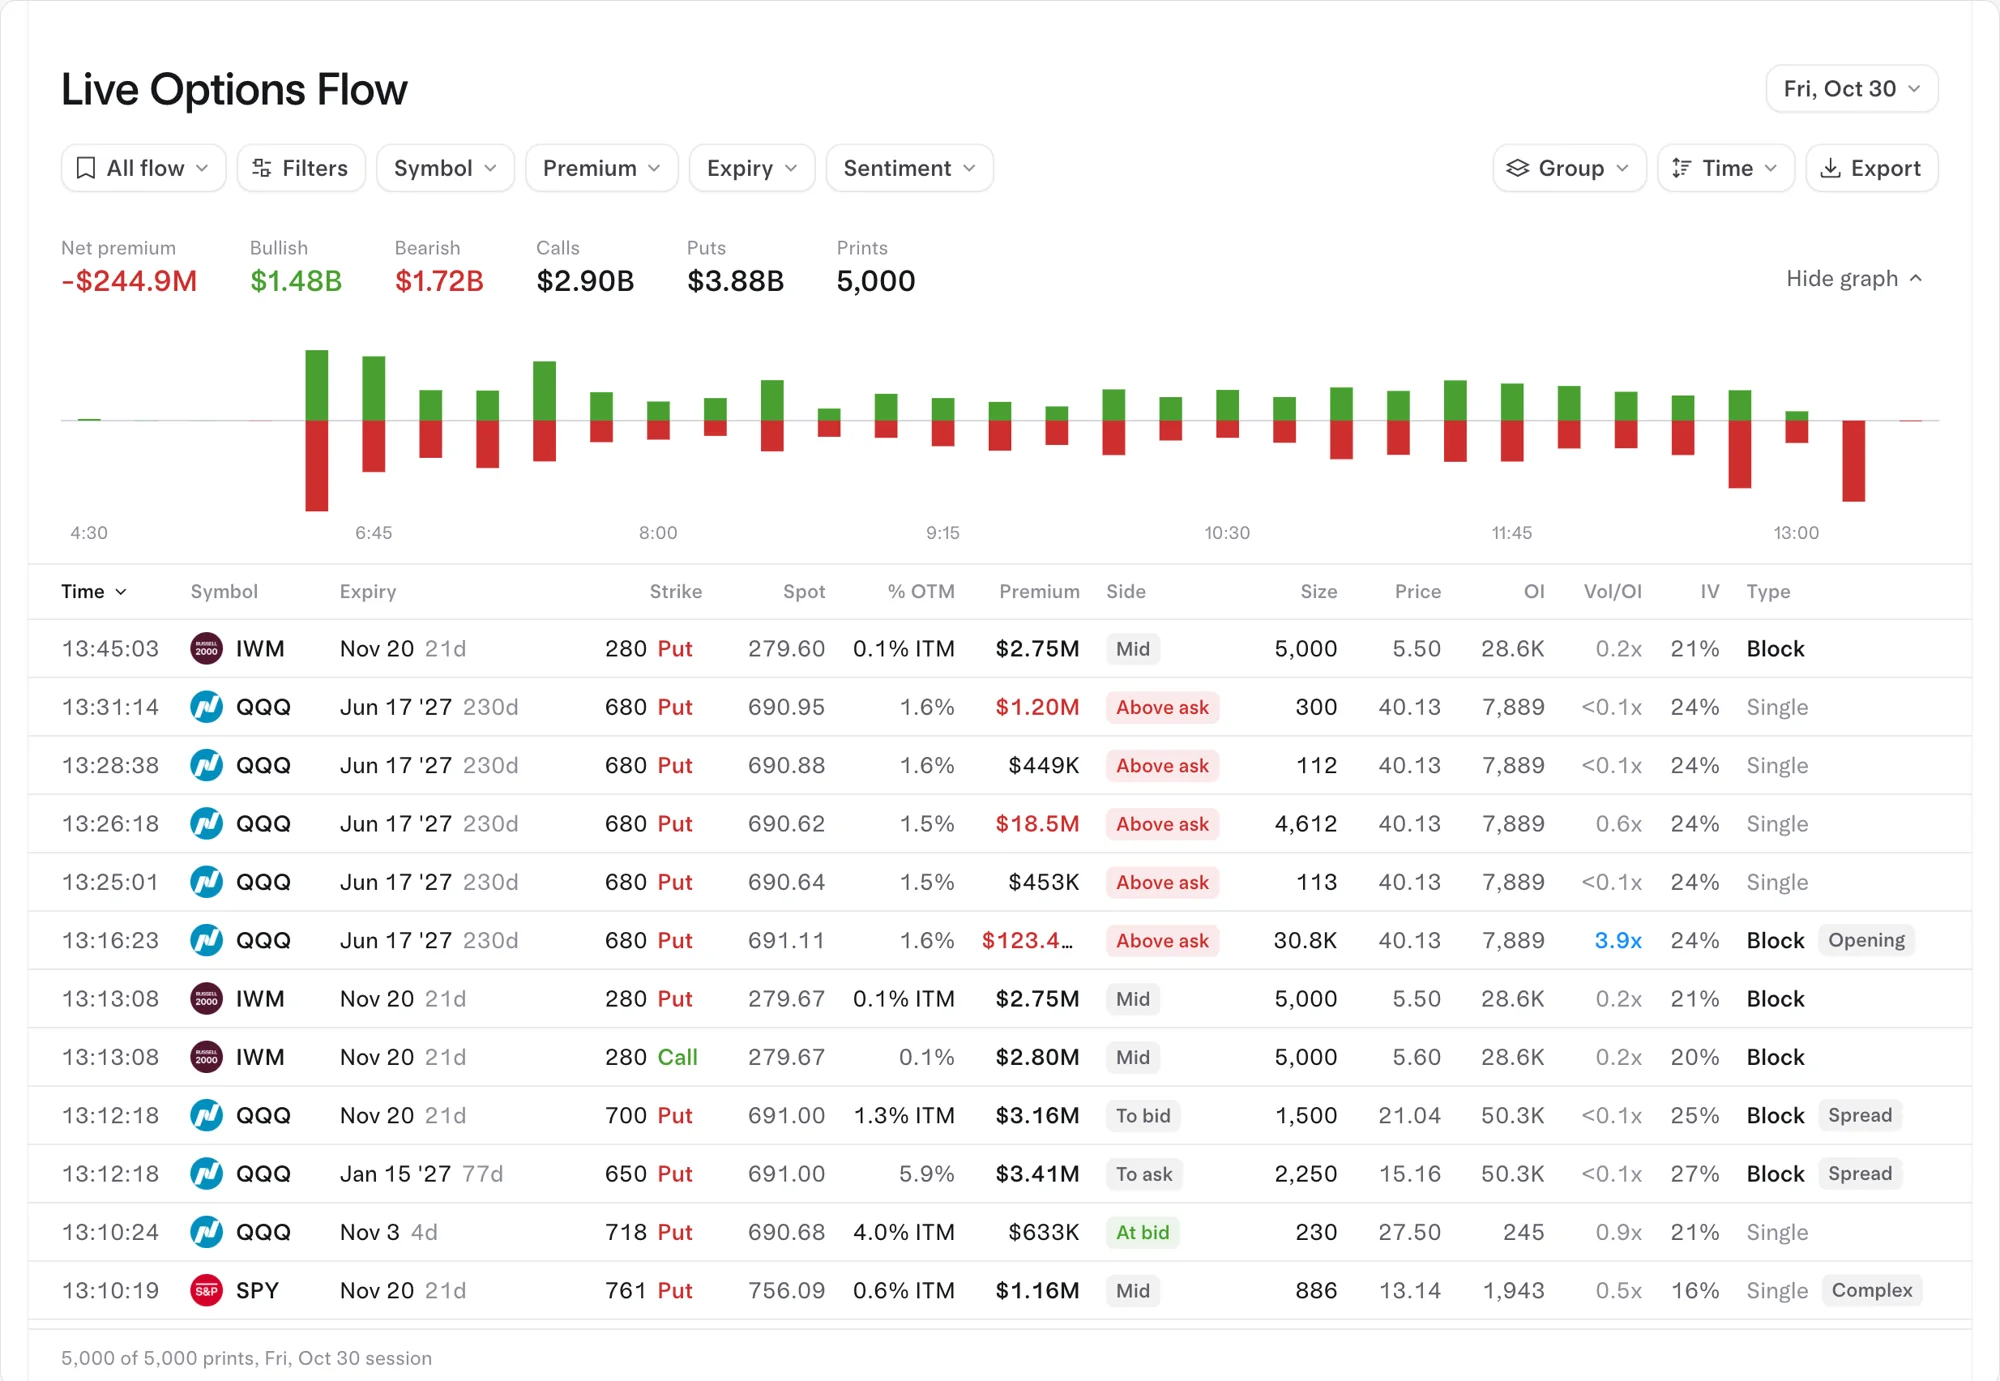
On the Live options flow page, the Symbol, Premium, Expiry and Sentiment menus sit at the top, with the Filters menu beside them. Each row shows the Side chip, Vol/OI, % OTM, Type and tags (Opening, Spread, Complex, ITM), so the checks above take a glance. The Group menu stacks prints together for the repeat-buying check. Live and Pro are live to the second; Free shows yesterday's session, which is a good place to practice. How to use the Tradytics options flow page walks through every control.
Common questions
What premium filter should I use?
One sized to the stock. Compare a trade with that ticker's usual daily options premium rather than using one number for everything.
Should I filter out ETFs and index options?
For single-stock bets, yes, because so much of the hedging happens in index and ETF options. For reading overall market fear, look at them separately.
What's the most useful single filter?
Size bigger than open interest combined with an aggressive side. Together they remove most closing trades and most mid-price packages.
Can filters tell me if a trade is a hedge?
Not on their own. A hedge and a bet can look identical in one row. Context like index puts, matching stock trades or a paired leg is what gives it away.
Sources
- Options Industry Council: General Information FAQ, how open interest changes with opening and closing trades and is reported after the day clears.
- Options Industry Council: Open Interest, Why It Matters, how OCC calculates open interest from the exchanges' trade reports.
- Options Order Protection and Locked/Crossed Market Plan (2009), Section 2 definition of an intermarket sweep order.
- OPRA, the consolidated tape of every options trade that flow filters run on.
- Most bullish options flow on 2026-11-02: MRVL ($22.86M net), AMZN ($15.80M net), TSLA ($12.21M net), LITE ($6.09M net), PLTR ($4.27M net).
- Most bearish options flow on 2026-11-02: AAPL ($40.91M net), AMD ($20.30M net), MU ($10.67M net), ORCL ($7.99M net), NVDA ($7.77M net).
Updated 2026-11-02 16:03 UTC