How to use the Tradytics options flow page
By Faizan Ahmad. Updated .
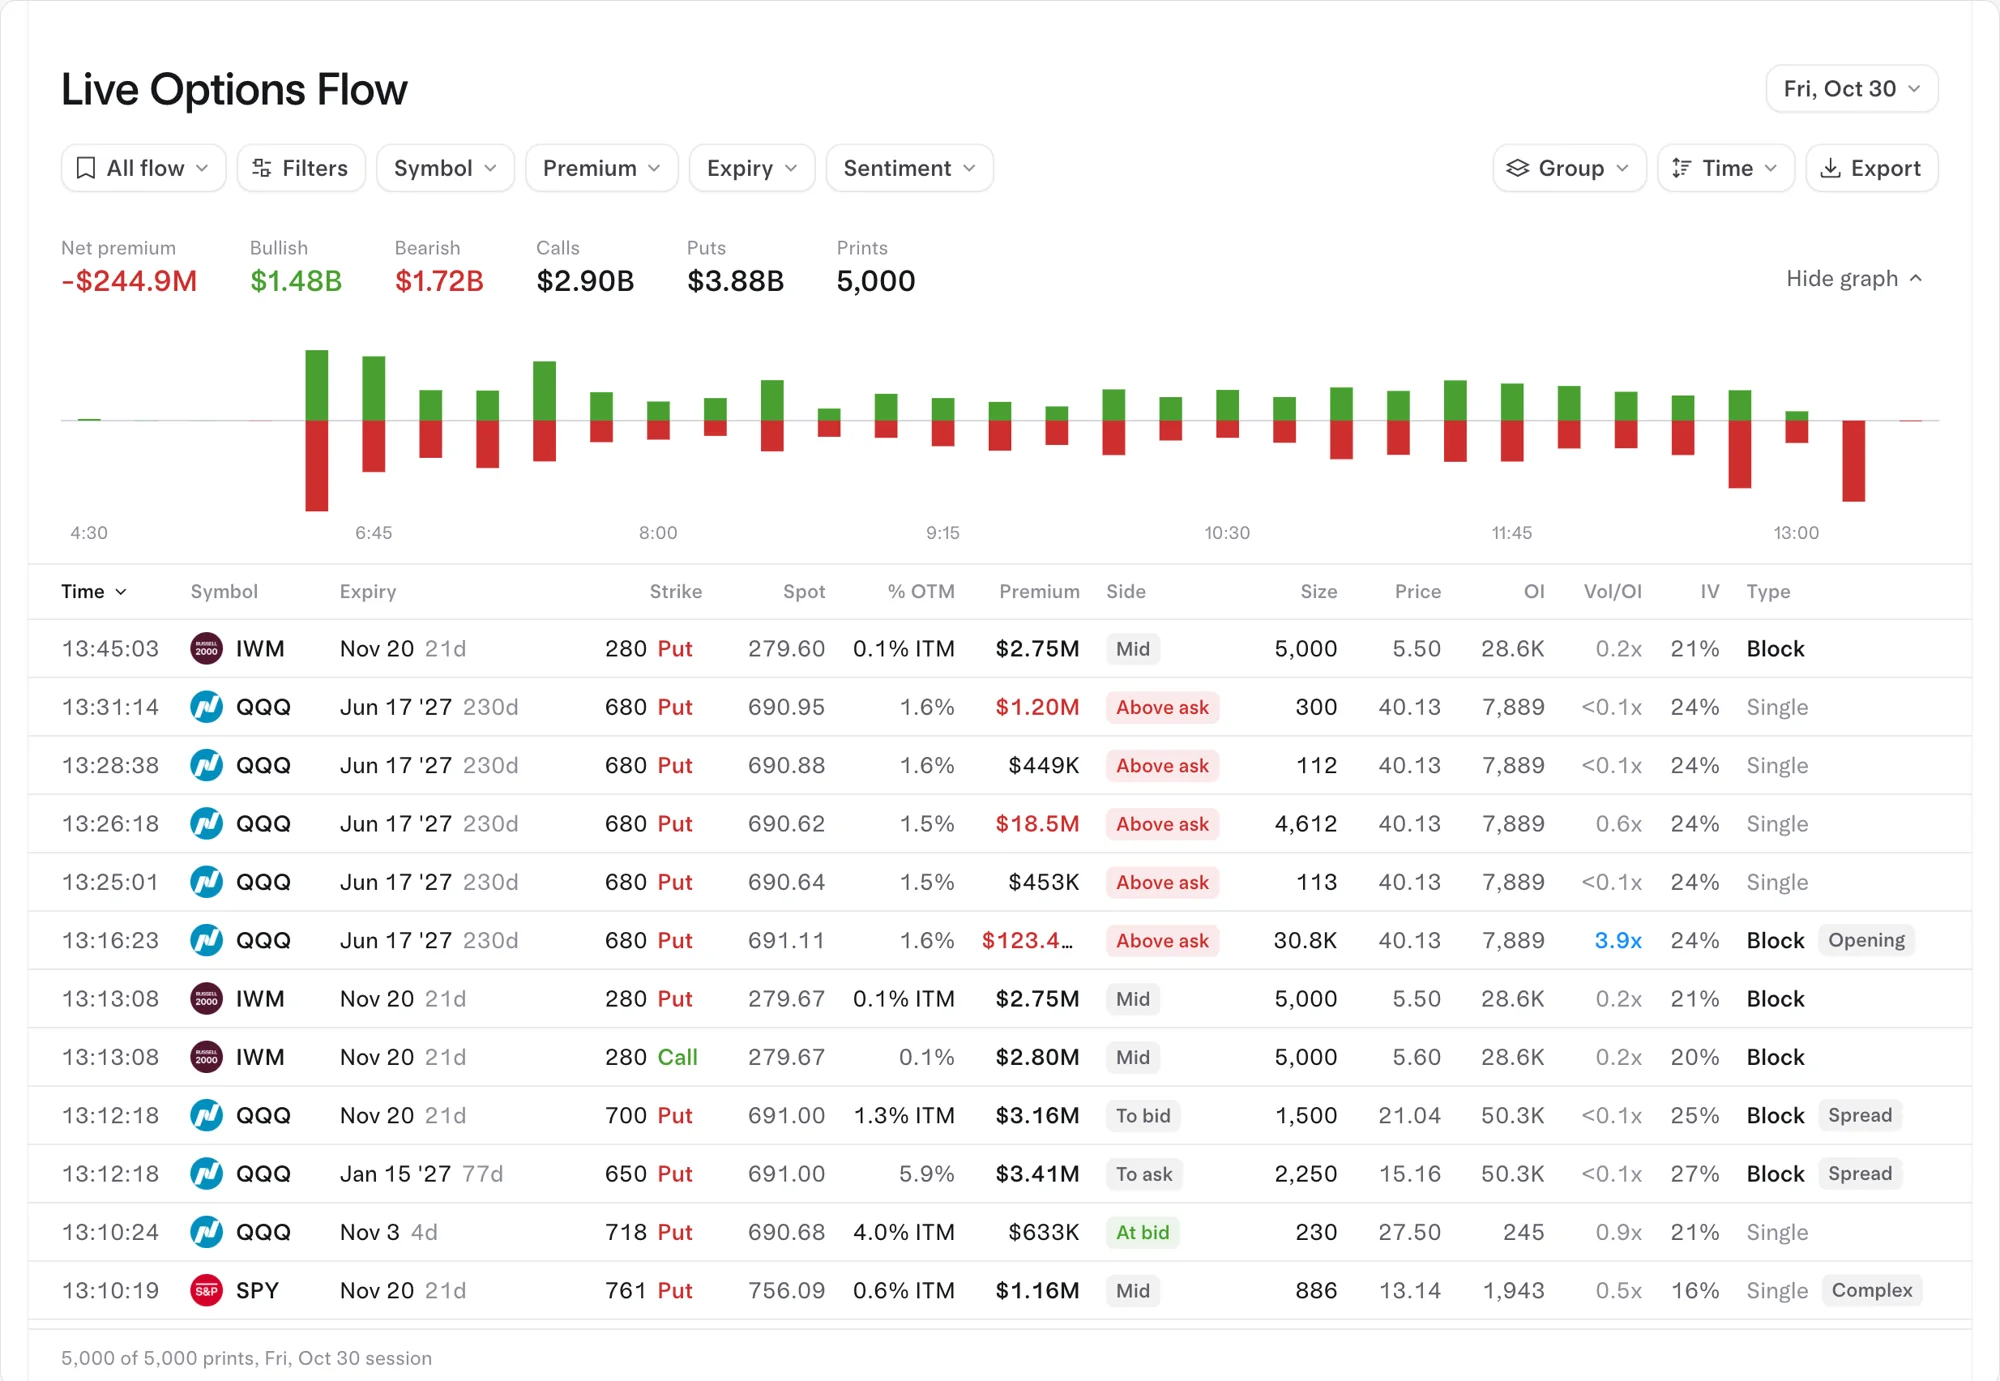
The Tradytics options flow page (Live Options Flow) lists the large options prints from every US options exchange, with the day's totals and a premium-by-minute chart on top. Read it in three passes: the totals for the day's lean, then each row's side chip to see who was in a hurry, then size against open interest, the type and the tags to judge whether a print is a fresh bet or part of something bigger. On Live and Pro the page is live to the second; on Free it shows yesterday's session.
What do you see on the options flow page?
Open Flow, then Options, in the left menu. The page has four parts, top to bottom.
- The filter bar: All flow, Filters, Symbol, Premium, Expiry and Sentiment narrow the list. Group, the Time sort and Export sit on the right, and the date at the top right shows which session you're looking at.
- The totals: Net premium, Bullish, Bearish, Calls, Puts and Prints.
- The premium bars: green bars above the line are bullish premium, red bars below are bearish, slice by slice through the day. Hide graph folds them away.
- The table: one row per print, sorted by time.
What does each column mean?
| Column | What it tells you |
|---|---|
| Time | When the print hit the tape. |
| Symbol | The stock or ETF. |
| Expiry | The expiration date, with days left (230d means 230 days). |
| Strike, Call or Put | The contract. |
| Spot | The stock's price at the moment of the print. |
| % OTM / ITM | How far the strike is from spot, out of the money or in the money. |
| Premium | Dollars that changed hands: contracts times price times 100. The best single measure of size. |
| Side | Where the fill landed against the bid and ask (chips below). |
| Size | Contracts traded in the print. |
| Price | The option's price per share. |
| OI | Open interest: contracts already open, counted once a day. |
| Vol/OI | The print's size divided by open interest. Above 1x means more contracts traded than were open. |
| IV | The contract's implied volatility. |
| Type | Sweep, Block, Split or Single. |
| Tags | Opening, Spread, Complex or ITM. |
How do you read the side chips?
The side chip is the first thing to read on any row, because it tells you which side was aggressive. A buyer who pays the ask, or a seller who hits the bid, wants the trade done now.
| Chip | What happened | On a call | On a put |
|---|---|---|---|
| Above ask, At ask, To ask | The buyer paid up (To ask means between the mid and the ask) | Leans bullish | Leans bearish |
| Mid | Filled halfway between bid and ask | No clear lean | No clear lean |
| To bid, At bid, Below bid | The seller hit the bid | Leans bearish | Leans bullish |
Net premium adds it up: bullish premium (calls bought, puts sold) minus bearish premium (puts bought, calls sold). For the full logic, see what "at the ask" and "at the bid" mean in options flow.
What do Type and Tags mean?
| Label | Meaning | What to do with it |
|---|---|---|
| Sweep | One order filled across several exchanges at once | Someone wanted the contracts right away |
| Block | A single trade of 5,000 or more contracts (Tradytics' cutoff) | Big size; check whether it's a hedge or one leg of a spread |
| Split | A large order filled in pieces on one exchange | Size worked in quietly |
| Single | One ordinary print | Judge it on premium and side |
| Opening | Size bigger than the contract's open interest | Most likely a new position |
| Spread | Part of a spread | Read the legs together, not as separate bets |
| Complex | A multi-leg order | Not a one-way bet |
| ITM | The strike is in the money | Moves more like stock; check for a spread |
The differences between the three order types are laid out in sweep vs block vs split, and the Opening tag in opening vs closing: how to tell from the flow.
A five-minute routine for the flow page
- Check the date and the totals. Is net premium positive or negative, and did the bars turn one color late in the day?
- Cut the noise with the filters: Premium to drop small prints, Symbol for one ticker, Sentiment for one direction. There's more on this in how to filter options flow and cut the noise.
- On each row that stands out, read the side chip first, then Vol/OI and the Opening tag.
- Read the type and tags. A Spread or Complex tag means the row is one leg of something bigger.
- Ask what else could explain it. A big put on an index ETF is often a hedge. Open the ticker's research page or ask the AI analyst before you treat a print as a bet.
Walkthrough: a $123.40M QQQ put on October 30, 2026
On October 30, 2026, QQQ fell 3.16% to $692.74, and the whole market leaned bearish, with net premium of -$86.53M across large prints. QQQ's biggest order of the day is the row with the Opening tag in the screenshot above: 30,750 contracts of the June 17, 2027 $680 put for $123.40M, with QQQ at $691.11 and open interest of 7,889. Here is how to read it.
- Side: Above ask. The buyer paid more than the asking price, an aggressive buy. A put bought leans bearish.
- Size against open interest: 30,750 contracts against 7,889 open is 3.9x, and the row carries the Opening tag, so this was most likely a new position, not someone closing one.
- Type: Block, far above the 5,000-contract cutoff.
- Contract: 230 days to expiry, strike 1.6% below spot, about $4,013 per contract ($40.13 a share).
Every box says "bearish bet". But think about who buys $123.40M of Nasdaq 100 downside eight months out, on a day the index ETF fell 3.16%. That profile fits a fund protecting a large stock portfolio as well as it fits a trader betting on a crash. Three more prints of 4,612 contracts in the same put followed within minutes, which looks like one buyer adding to the same position. The flow tells you the size, the urgency and that the position is new; it can't tell you the reason. That last step is covered in how to tell if a big options trade is a hedge, and it's where the AI analyst helps: ask it about a print and it reads the side, tags and context for you.
The flow page screenshot at the top has a second lesson: two QQQ put blocks printed in the same second, one To bid and one To ask, both tagged Spread. That's one position with two legs, not two separate bets in opposite directions.
What does Free show versus Live and Pro?
| Free | Live | Pro | |
|---|---|---|---|
| Price | $0 | $39 a month or $299 a year | $69 a month or $499 a year |
| Options flow page | Yesterday's session | Live, to the second | Live, to the second |
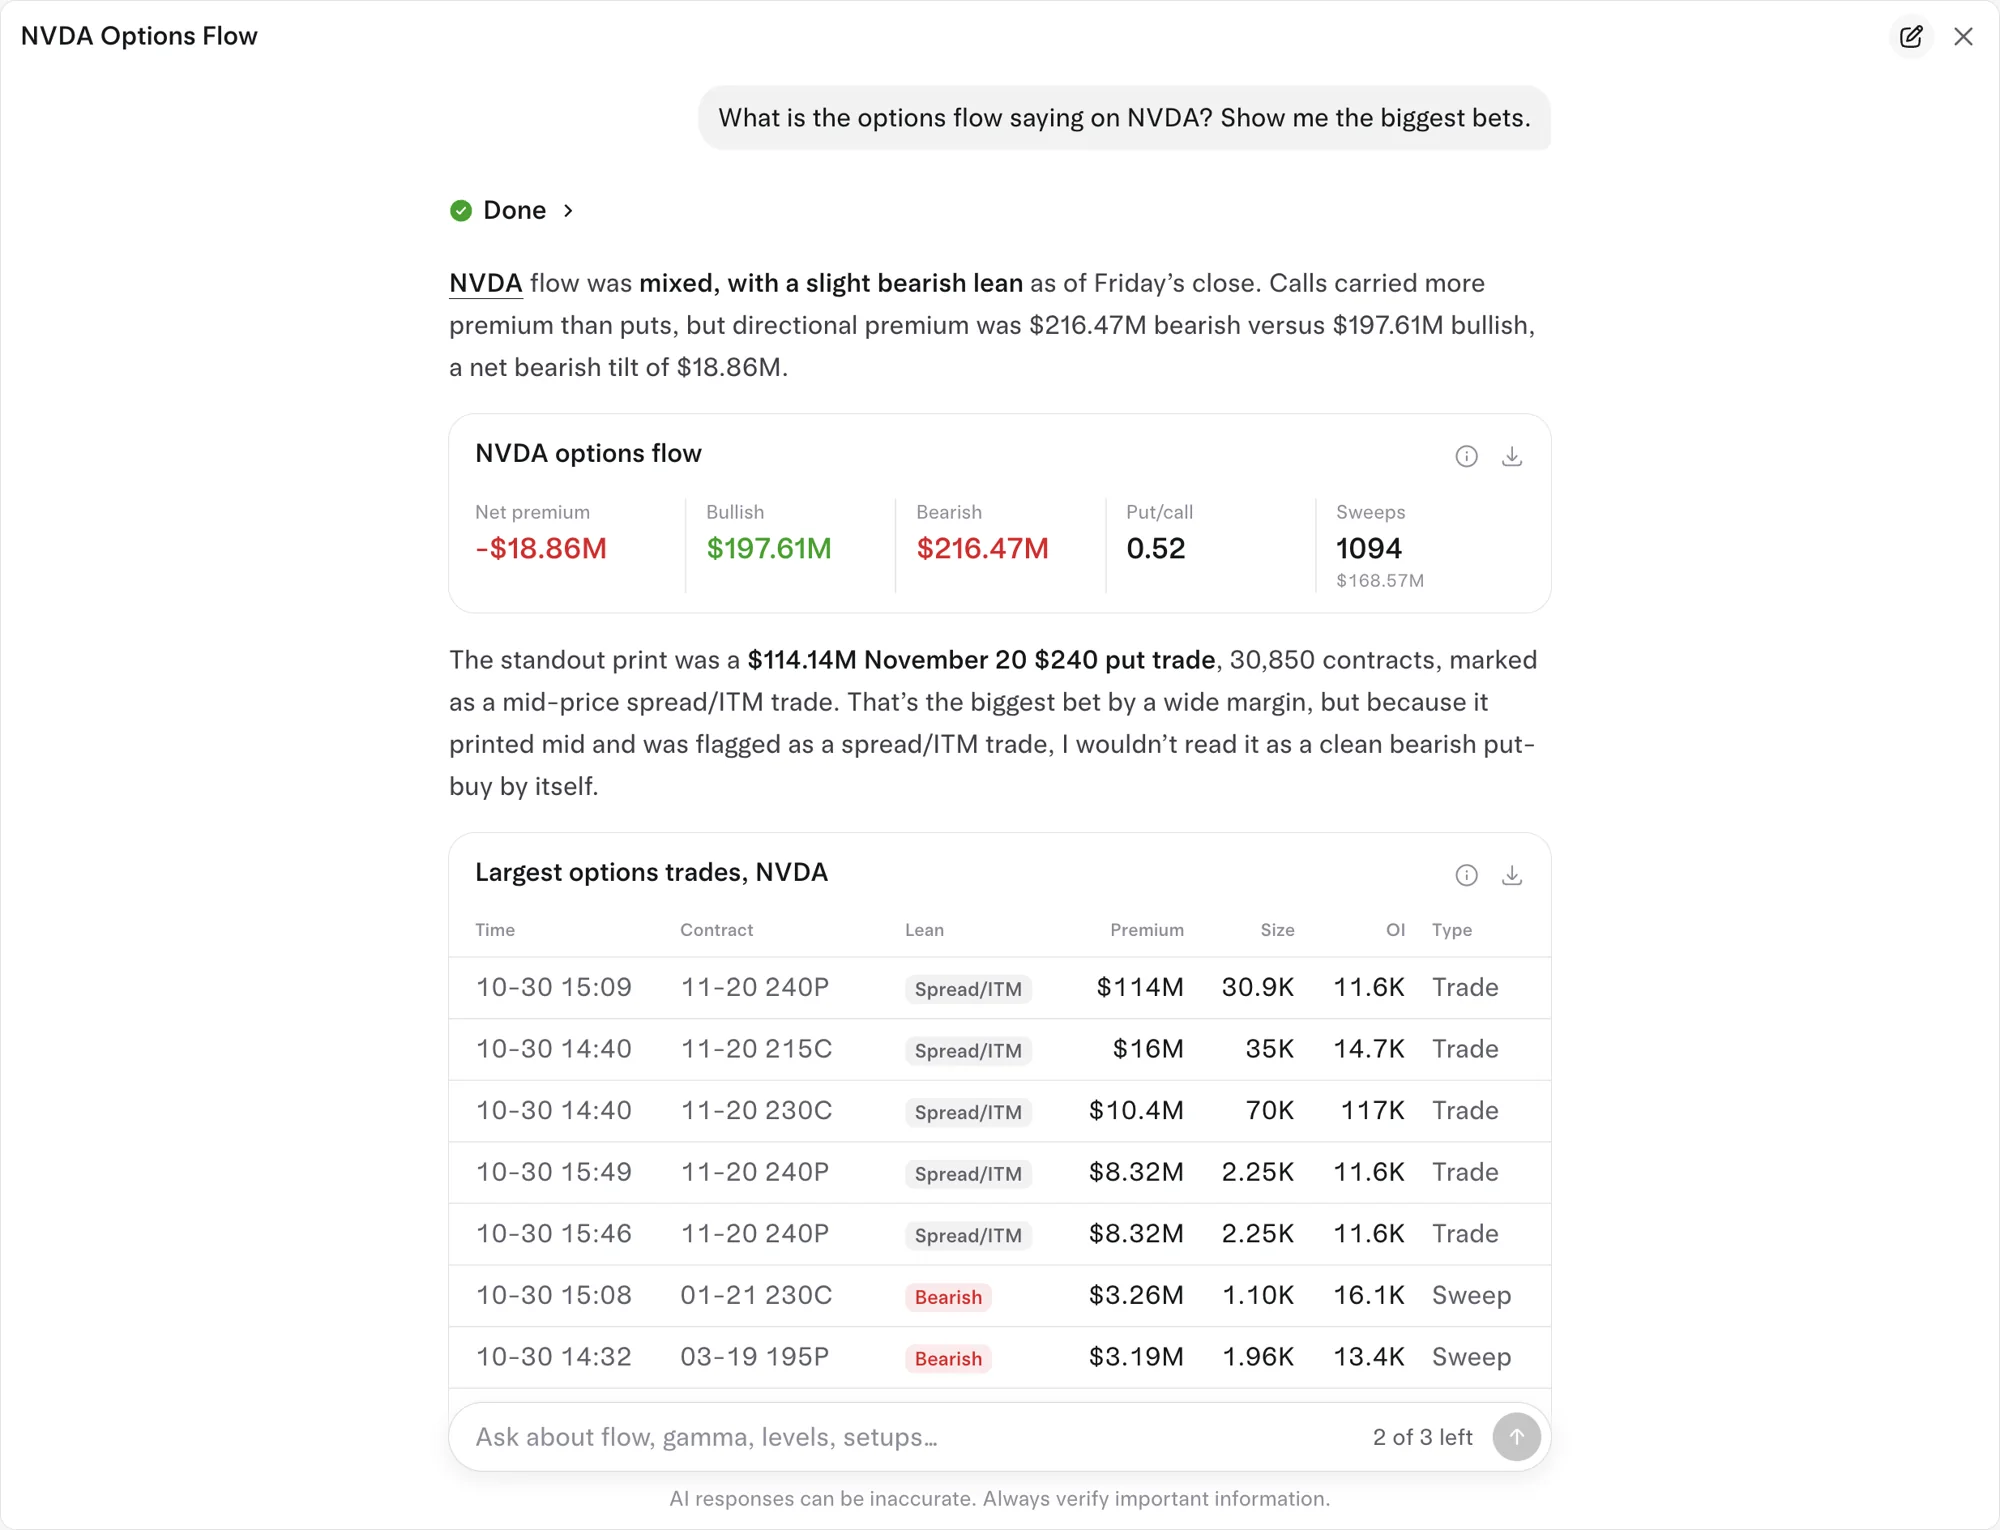
| AI analyst questions (to explain a print) | 3 a day | 20 a day | Unlimited |
Free is enough to learn the page and to do homework on yesterday's prints before the open. Live and Pro are for watching flow while the market is open.
Common questions
Is the Tradytics options flow real time?
On Live and Pro, yes. Prints come from OPRA, the consolidated tape of every US options exchange, and show live to the second. Free shows the full previous session.
How does Tradytics decide whether a print is bullish or bearish?
By the side and the contract type. Calls bought at or above the ask and puts sold at or below the bid lean bullish; puts bought and calls sold lean bearish. Mid prints get no lean.
Does the Opening tag prove a position was opened?
No, but it's strong evidence. The print was bigger than all the contracts that were open, so it couldn't all be closing trades, and most likely it opened a new position. You can confirm the next day, when open interest updates.
Can Tradytics tell me if a big trade is a hedge?
No tool knows for sure. The Tradytics AI analyst reads the side, the tags and the context and tells you what a trade likely is, such as a spread or a hedge rather than a clean bet.
Sources
- Options Price Reporting Authority (OPRA): the securities information processor that disseminates consolidated last sale and quotation information from the US options exchanges.
- FINRA: Options: FINRA's investor guide to calls, puts, premium and the risks of options.