Tradytics vs Finviz
By Faizan Ahmad. Updated .
Finviz is a stock screener and market map; Tradytics is an options flow and dark pool app with a scanner, research and an AI analyst. Pick Finviz Elite ($39.50 a month or $299.50 a year as of October 2026) if you screen stocks during the day on real-time quotes, live in heat maps and want unlimited alerts and data export. Pick Tradytics (Live, $39 a month or $299 a year) if you trade options and want live flow, dark pool prints and dealer gamma. They also work side by side: Finviz to find the stock, Tradytics to see what the options market is doing in it.
How do Tradytics and Finviz compare?
The prices are nearly identical; the tools aren't. Finviz is built around stocks: screener, heat maps, charts, news and insider trades. Tradytics is built around options and dark pool money, with a scanner and research for every US stock and ETF around it.
| Tradytics | Finviz | |
|---|---|---|
| Plans, monthly | Free $0, Live $39, Pro $69 | Free $0, Elite $39.50 |
| Plans, yearly | Live $299, Pro $499 | Elite $299.50 ($24.96 a month) |
| Free plan | Every page and tool on yesterday's session | Delayed data, basic filters, 1 portfolio |
| Free trial | None (the Free plan instead) | Yes; card required, renews into Elite; length not stated on its pricing page |
| Data timing | Options flow live to the second (Live, Pro); dark pool prints within about 15 minutes | Elite: real-time stock quotes, including pre-market and after hours; footer says futures and options are delayed 15 minutes |
| Screener | 120 signals (price, technicals, chart patterns, fundamentals, options flow, dark pool); updated after the close | Core product; advanced filters on Elite |
| Heat map | S&P 500 heatmap on the Markets page; options money map by net premium | Core product |
| Options flow | Live on Live and Pro, with side, size vs open interest and tags | Not listed |
| Dark pool prints | Within about 15 minutes, with 10-session levels | Not listed |
| Dealer gamma (GEX) | By strike, with call wall, put wall and gamma flip | Not listed |
| Insider and Congress trades | Both, on the Markets page | Insider trades |
| Charts | Live charts, drawing tools, indicators, up to four at once | Interactive multi-layout charts on Elite |
| AI | AI analyst: 3, 20 or unlimited questions a day | Not listed |
| Data out | Pro: API (50,000 calls a day) and MCP server | Elite: export for your own workflows and AI agents |
| Your portfolio | Read-only broker linking on every plan; factors and versus on Live and Pro | Up to 100 portfolios on Elite; broker linking not listed |
| Cancelling and refunds | Cancel anytime, keep access to the end of the period | Refunds on written request during the first 30 days |
Prices checked October 31, 2026. US list prices from each company's own pages.
Where Finviz wins
- Stock screening speed and breadth. Finviz's screener is the fastest broad stock screener around, and its heat maps show the whole market at a glance. If stocks are your market, it does that job better than Tradytics.
- Screening during the session. Elite gives real-time stock quotes, including pre-market and after hours. Tradytics' scanner updates after the close (4:05, 6:05 and 8:10 PM ET), so for intraday stock screens, Finviz Elite is the better tool.
- Alerts. Unlimited email alerts and push notifications on Elite.
- Export. Elite exports data for your own automated workflows and AI agents.
- A refund window. Finviz refunds Elite on written request during the first 30 days.
- Portfolios. Up to 100 portfolios on Elite for tracking ideas by hand.
Where Tradytics wins
- Options flow. Every large print from OPRA, live to the second on Live and Pro, with the side (bought at the ask or sold at the bid), size against open interest, sweeps, blocks and an Opening tag. Finviz doesn't list options flow.
- Dark pool prints and levels. About 12,000 off-exchange and block prints a session, within about 15 minutes of their report, with levels from 10 sessions of prints. Not listed on Finviz.
- Dealer gamma. Call wall, put wall and gamma flip by ticker, on every plan.
- A scanner that sees options and dark pools. The Tradytics scanner mixes price, technicals, chart patterns and fundamentals with options flow and dark pool signals, with one-click screens for breakouts, bullish flow and squeeze setups.
- An AI analyst. Ask in plain words and it pulls flow, dark pool prints, gamma, prices, news and the scanner itself, then answers with cards and tables, including what a big trade likely is: a hedge, a spread or a fresh bet.
- Congress trades too. Insider and Congress trades both sit on the Markets page.
- Your portfolio. Read-only broker linking on every plan, and on Live and Pro, factors (did you beat the S&P 500 through skill or market exposure?) and versus (your holdings' valuation, growth, flow and dark pool metrics against the market).
What a heat map misses: a real example
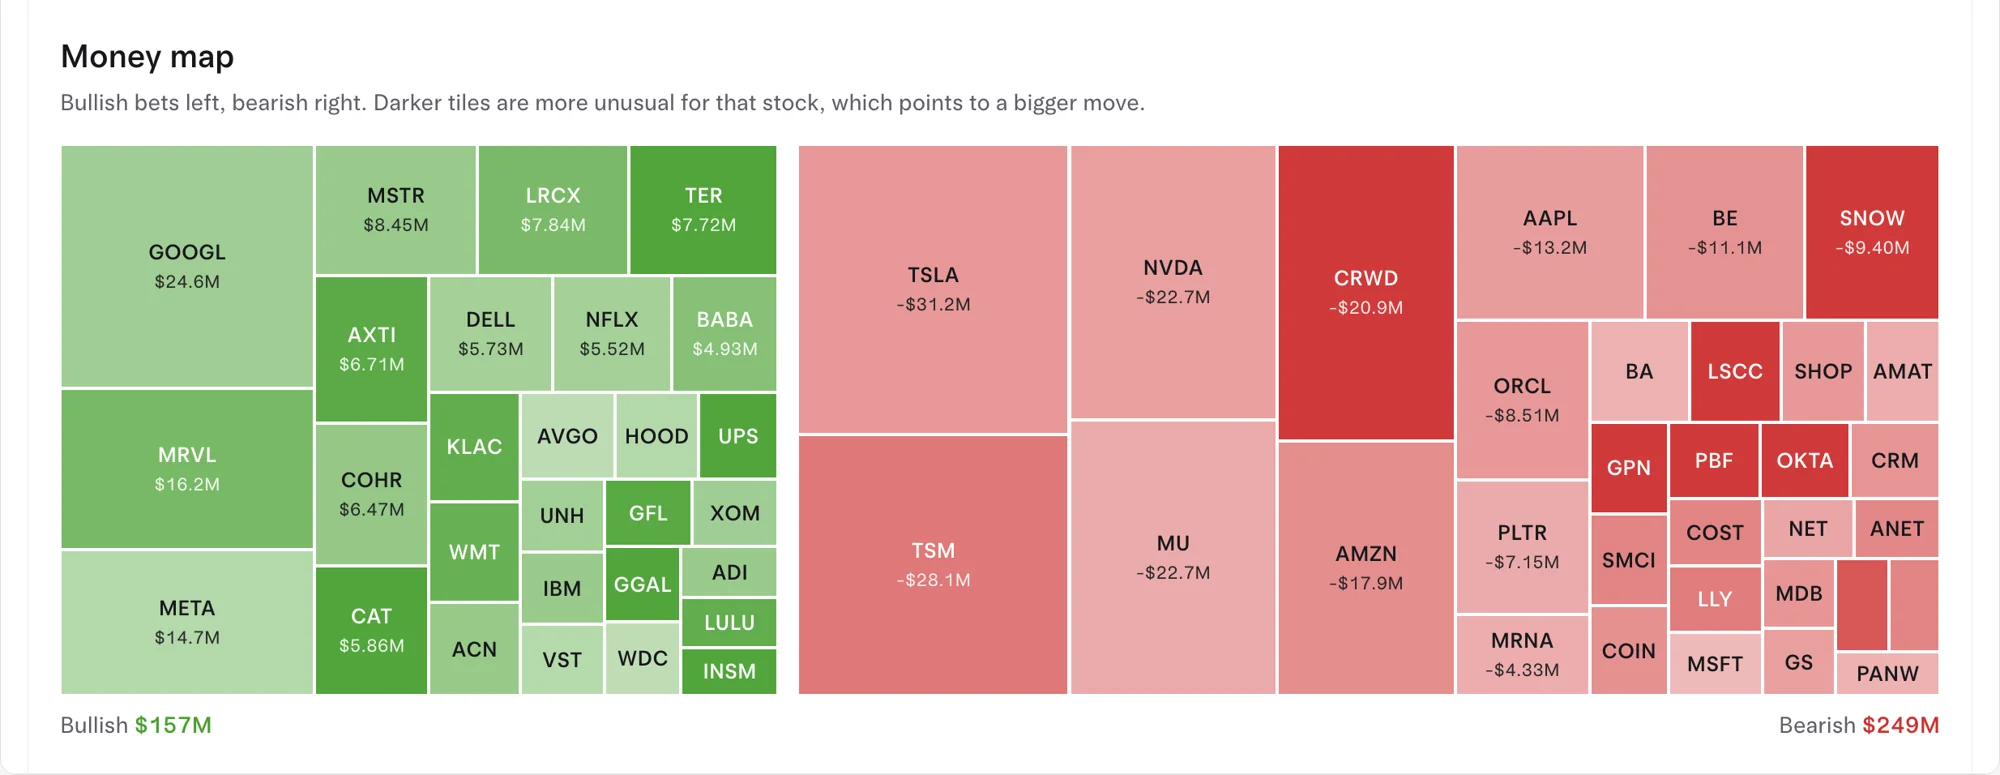
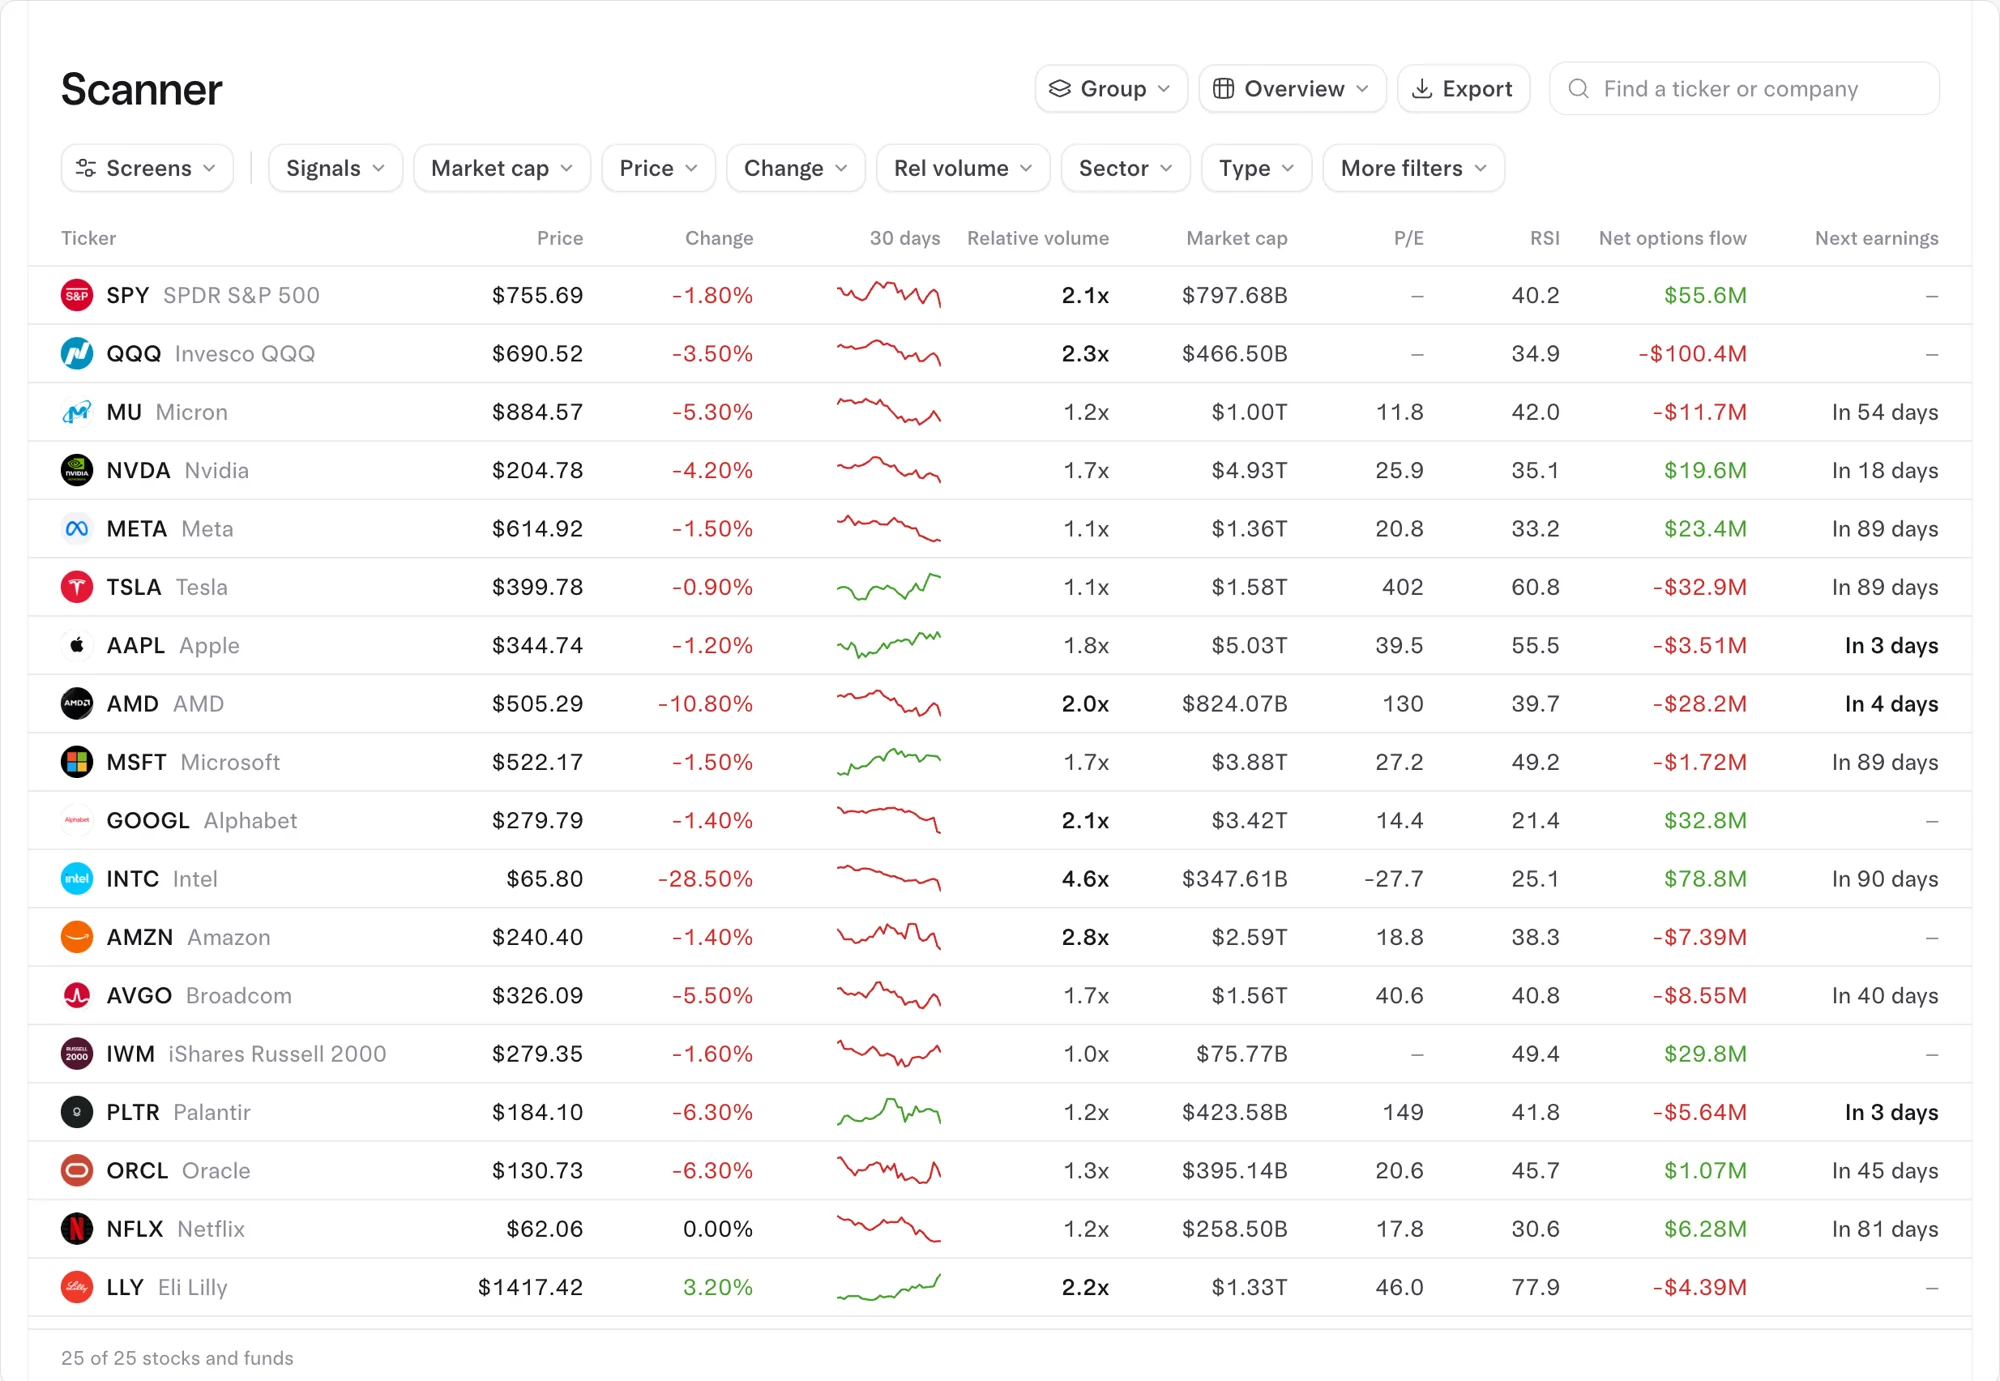
On October 30, 2026, the S&P 500 fell 1.59% and the Nasdaq 100 dropped 3.16%. Technology sank 4.55%, AI chips fell 9.29%, and 1,562 stocks declined against 829 that rose. Any heat map that day was a wall of red.
The options tape added what the map couldn't. Market-wide net premium leaned bearish at -$86.53M, yet Citigroup drew the most bullish options money of any stock ($93.80M net of $215.39M traded) while its shares fell 2.6%, including 5,350 December 18 $75 calls bought at the ask against open interest of 2,675. AMD, down 10.3% ahead of its Tuesday earnings, saw net premium of -$28.20M and a put/call ratio of 1.56. Neither tells you what happens next. Together they tell you where traders were putting money on a day the map only showed red. Here's how net options flow works.
Who should choose which
Choose Finviz if:
- You trade stocks, not options, and want the fastest broad screener and heat maps.
- You screen during the session and need real-time quotes, including pre-market and after hours.
- You want unlimited alerts and export to your own tools.
Choose Tradytics if:
- You trade options and want live flow, dark pool levels and gamma.
- You build your watchlist after the close, when the scanner updates.
- You want an AI analyst to read the data, or want to know whether your portfolio is beating the market on skill.
Use both if you find stocks on Finviz and trade them with options. Free Finviz plus Tradytics Live is $39 a month; Finviz Elite plus Tradytics Live is $78.50 at list prices as of October 2026. The scanner guide covers how far Tradytics' scanner goes on its own.
Common questions
Does Finviz have options flow?
Not as of October 2026: options flow isn't listed, and the site's footer says futures and options data are delayed 15 minutes. Tradytics shows options flow live to the second on Live and Pro.
Is Finviz Elite or Tradytics cheaper?
They're almost the same. Finviz Elite is $39.50 a month or $299.50 a year; Tradytics Live is $39 a month or $299 a year, and Pro is $69 a month or $499 a year. For the wider field, see options flow prices side by side.
Can Tradytics replace Finviz?
For an options trader who screens after the close, Tradytics' 120-signal scanner and Markets page cover a lot. For screening stocks during the day on real-time quotes, or if heat maps are your workflow, keep Finviz.
Does Finviz have dark pool data?
Dark pool prints aren't listed on Finviz. Tradytics shows them within about 15 minutes of their report, with levels built from 10 sessions; the best dark pool data tools compares the options.
Do both show insider trades?
Yes. Finviz covers insider trades, and Tradytics shows insider and Congress trades on its Markets page.
Sources
- Finviz: Elite: Elite prices, Free vs Elite features, trial terms, the refund window and the futures and options delay note.
- Finviz: Help FAQ: trial terms, refunds and stock quote delays for free and Elite accounts.
- OPRA (Options Price Reporting Authority): the consolidated last-sale and quote feed from US options exchanges that Tradytics' flow is built on.