How the Tradytics scanner works
By Faizan Ahmad. Updated .
The Tradytics scanner (/scanner) runs every US stock and ETF through 120 signals covering price, technicals, chart patterns, fundamentals, options flow and dark pool activity. You filter the list or pick a one-click screen such as breakouts, bullish flow or squeeze setups, then open the names that pass in their research pages. It updates after the close, at 4:05, 6:05 and 8:10 PM ET, so it's built for planning the next session, not for catching a move mid-day. It's included on every plan, Free too.
What do you see on the scanner?
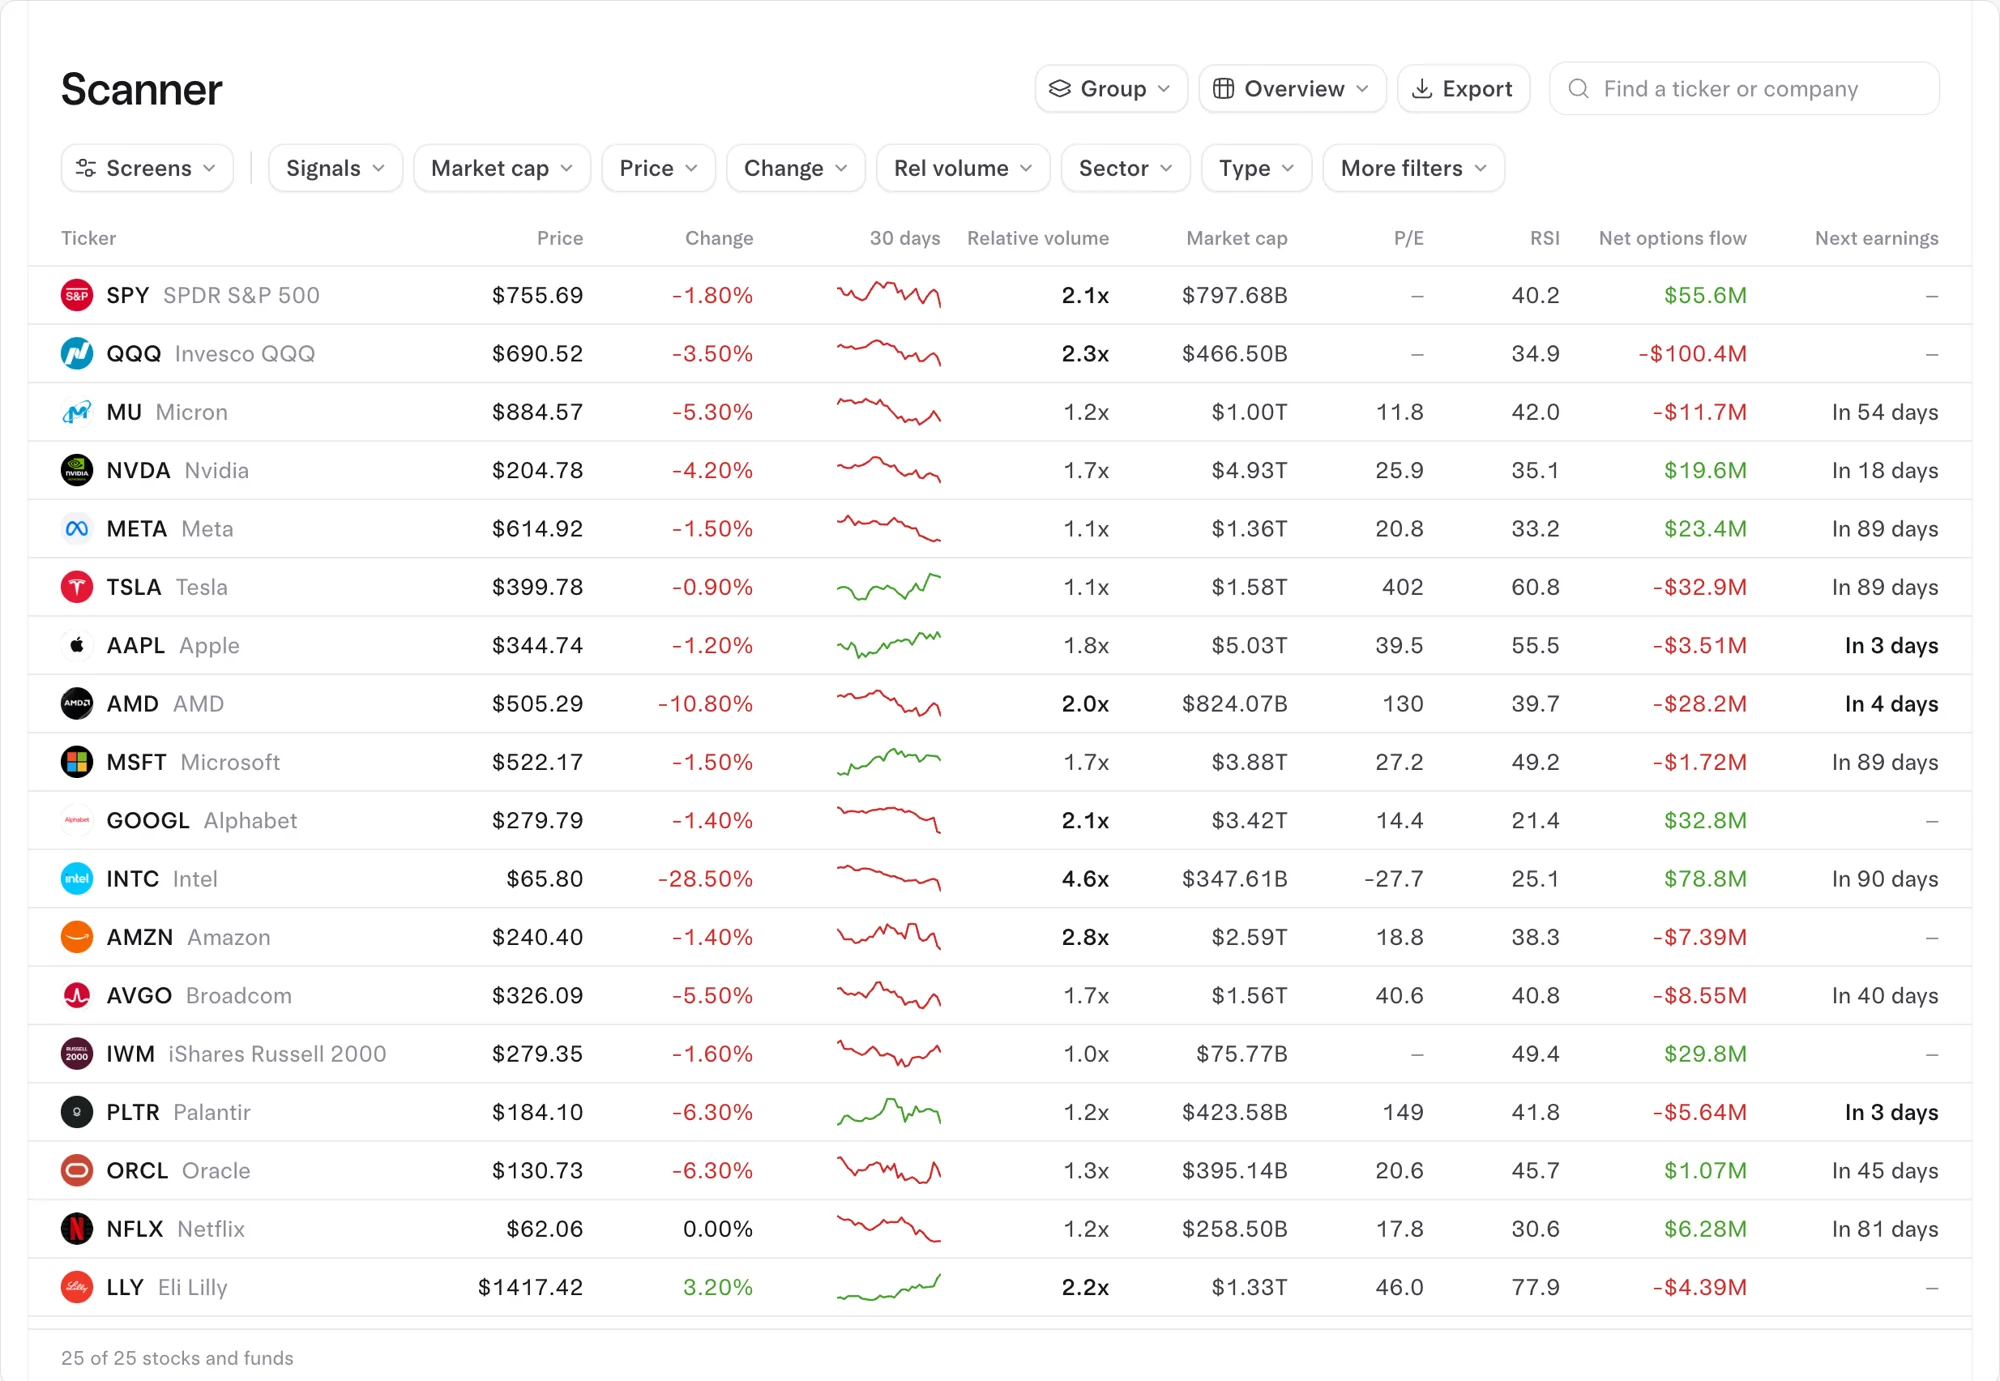
Open Scanner in the left menu. The page has three parts.
- The top bar: Group, a column view (Overview in the screenshot), Export and a search box to find a ticker or company.
- The filter row: Screens, Signals, Market cap, Price, Change, Rel volume, Sector, Type and More filters.
- The table: in the Overview view, Ticker, Price, Change, 30 days (a small price chart), Relative volume, Market cap, P/E, RSI, Net options flow and Next earnings.
What are the scanner's 120 signals?
They fall into six groups. The Overview view shows a few as columns; the Screens, Signals and More filters menus are where you narrow by the rest.
| Signal group | What it looks at | In the Overview view |
|---|---|---|
| Price | Price level, the day's change and volume against normal | Price, Change, 30 days, Relative volume |
| Technicals | Indicators calculated from price, such as RSI | RSI |
| Chart patterns | Shapes on the price chart, such as breakouts | Through Screens and Signals |
| Fundamentals | Company numbers such as size and valuation | Market cap, P/E, Next earnings |
| Options flow | Where options money leaned on each stock | Net options flow |
| Dark pool | Off-exchange trading in each stock | Through Screens and Signals |
The one-click screens (breakouts, bullish flow, squeeze setups) are ready-made, so you can start with one click instead of building filters.
When does the scanner update?
Three times after the close: 4:05, 6:05 and 8:10 PM ET. It doesn't update during the session, so a stock that breaks out at 11 AM shows up in that evening's scan. Check it after 4:05 PM to start the next day's list, and again later in the evening.
A routine: building tomorrow's list
- Open the scanner after 4:05 PM ET.
- Start with a screen (breakouts, bullish flow or squeeze setups) or your own filters, such as Market cap to stick to large companies.
- Read three things on each row: Change and Relative volume for what moved on real volume, Net options flow for where options money leaned, and Next earnings for what's coming.
- Open the names that pass in their research pages: the options page for implied volatility and the expected move, the dark pool page for levels.
- Put the final few on a watchlist on the charts page.
Walkthrough: earnings week, October 30, 2026
The scan after the close on October 30, 2026 showed two large names reporting within days: Apple (next earnings in 3 days, on Monday) and AMD (in 4 days, on Tuesday). The Net options flow column told them apart.
- Apple: -$3.51M, close to even. Its options page showed where the action really was: implied volatility at 42.4%, up 12.3 points in a day, and an expected move of about $16.49 either way by November 4.
- AMD: -$28.20M, one of the most bearish names in the whole market that day, after Intel's weak outlook rattled chip stocks. Its options page showed puts bought ($98.69M) well ahead of puts sold ($81.72M), implied volatility at 74.3%, up 6.6 points, and an expected move of about $20.17 either way by November 2.
Neither row is a trade by itself. What the scanner did was cut thousands of tickers down to two worth reading, with the reason (earnings plus heavy options money) visible right in the row. From there, the work moves to the research pages and, if you're buying options into a report, to implied volatility, because options priced for a big move need a bigger one to pay.
What does Free show versus Live and Pro?
| Free | Live | Pro | |
|---|---|---|---|
| Price | $0 | $39 a month or $299 a year | $69 a month or $499 a year |
| Scanner | Yes | Yes | Yes |
| Update times | 4:05, 6:05 and 8:10 PM ET | 4:05, 6:05 and 8:10 PM ET | 4:05, 6:05 and 8:10 PM ET |
| Options flow on the research pages you open from it | Yesterday's session | Live, to the second | Live, to the second |
The scanner itself is the same tool on every plan. What changes is how fresh the flow and dark pool data is on the pages you click into.
Common questions
Is the Tradytics scanner real time?
No. It updates after the close at 4:05, 6:05 and 8:10 PM ET. For intraday moves, use the options flow page on Live or Pro.
How many stocks does the scanner cover?
Every US stock and ETF, run through 120 signals.
Can I scan on options flow and dark pool data?
Yes. Options flow and dark pool activity are two of the six signal groups, alongside price, technicals, chart patterns and fundamentals. What is net options flow? explains the flow column.
Is the Tradytics scanner free?
Yes, it's on the Free plan, along with charts, research, dealer gamma and the strategy builder.
How do I use scanner results for swing trades?
Treat the scan as a shortlist, then confirm each name with its flow and levels. How to use options flow for swing trading walks through it.
Sources
- SEC EDGAR full-text search: the SEC's search of company filings, the primary record for company fundamentals and earnings reports.
- Options Price Reporting Authority (OPRA): the consolidated last sale and quotation feed from the US options exchanges.
- FINRA: Trade Reporting Facility (TRF): where off-exchange (dark pool) trades are reported.