How to research a stock, its options and its dark pool on Tradytics
By Faizan Ahmad. Updated .
Every US stock and ETF on Tradytics has three research pages: the stock page (/research/AAPL), the options page (/research/AAPL/options) and the dark pool page (/research/AAPL/darkpool). Read them in that order: the stock page tells you what the company is and why it's moving, the options page tells you how traders are positioned and how big a move they're pricing, and the dark pool page shows the prices where big money traded. All three are on every plan; on Free, the options flow and dark pool parts show yesterday's session.
How do you open a stock's research pages?
Type the ticker in the search box at the top left, or open Research in the left menu and pick Stock, Options or Darkpool. The URLs follow one pattern, so /research/SPY/options or /research/TSLA/darkpool work the same way. Your watchlist sits on the right of every research page.
What's on the stock page?
Tabs across the top jump to each part: Chart, Statistics, Analyst, Earnings, Insider, Financials and Peers.
- Chart: the price at the close and after hours, a chart from one month to one year, and a Full chart button.
- Why it's moving: a short story on the day's move, written each day by Tradytics' AI for the 100 largest stocks and the most-viewed others.
- Statistics: market cap, valuation, margins, revenue, beta, short interest and volume.
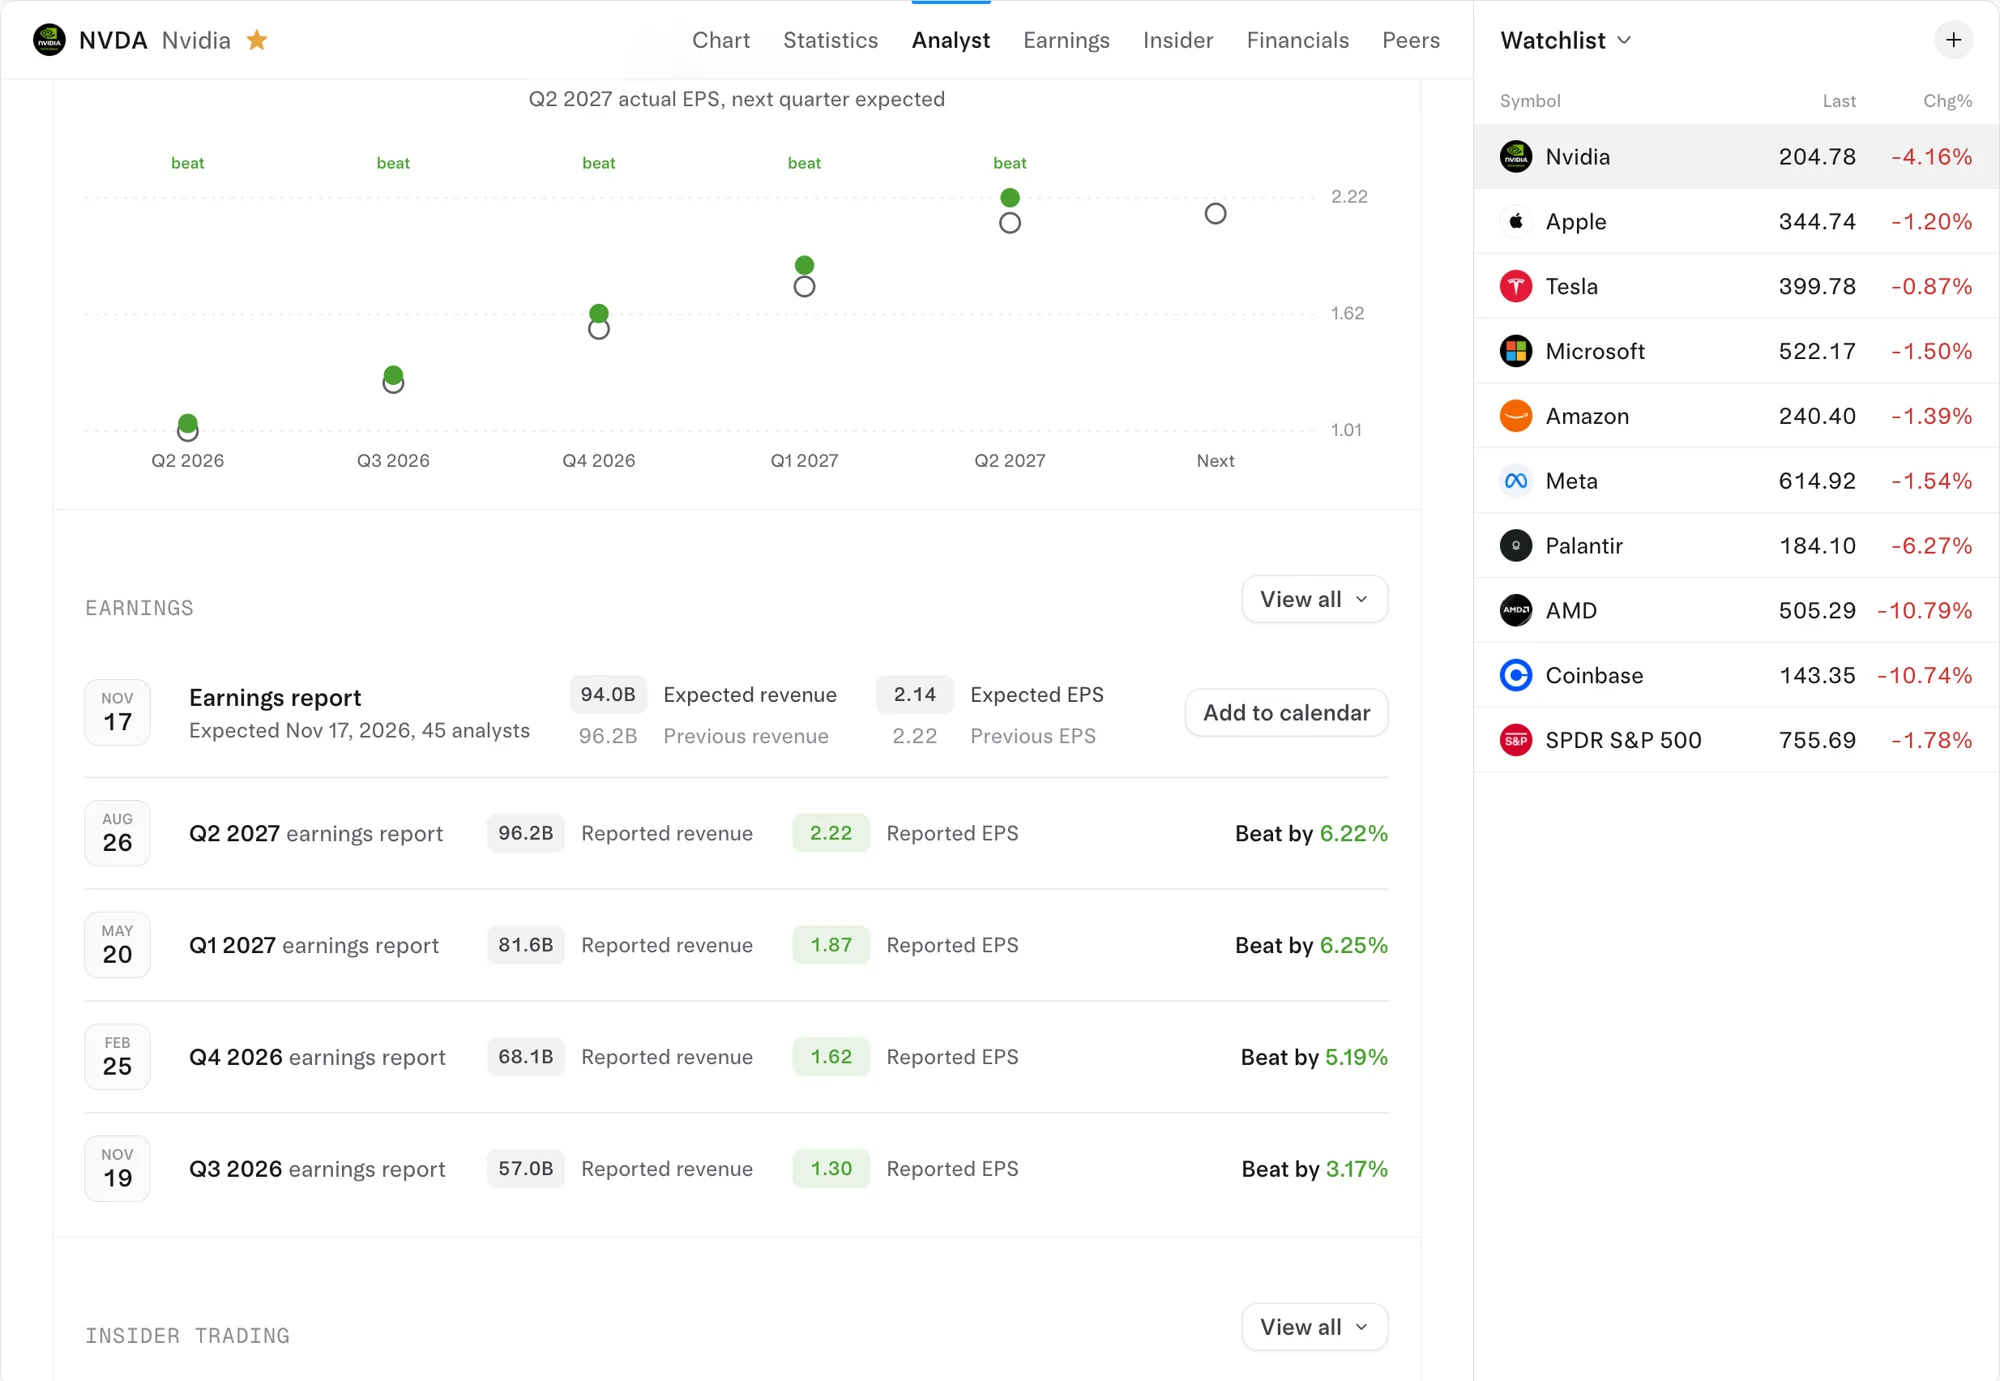
- Analyst: the average price target, ratings and earnings per share against estimates.
- Earnings: the next report date with expected revenue and EPS, and past reports with how much they beat or missed by.
- Insider, Financials and Peers: insider trades, the financial statements and similar companies.
What's on the options page?
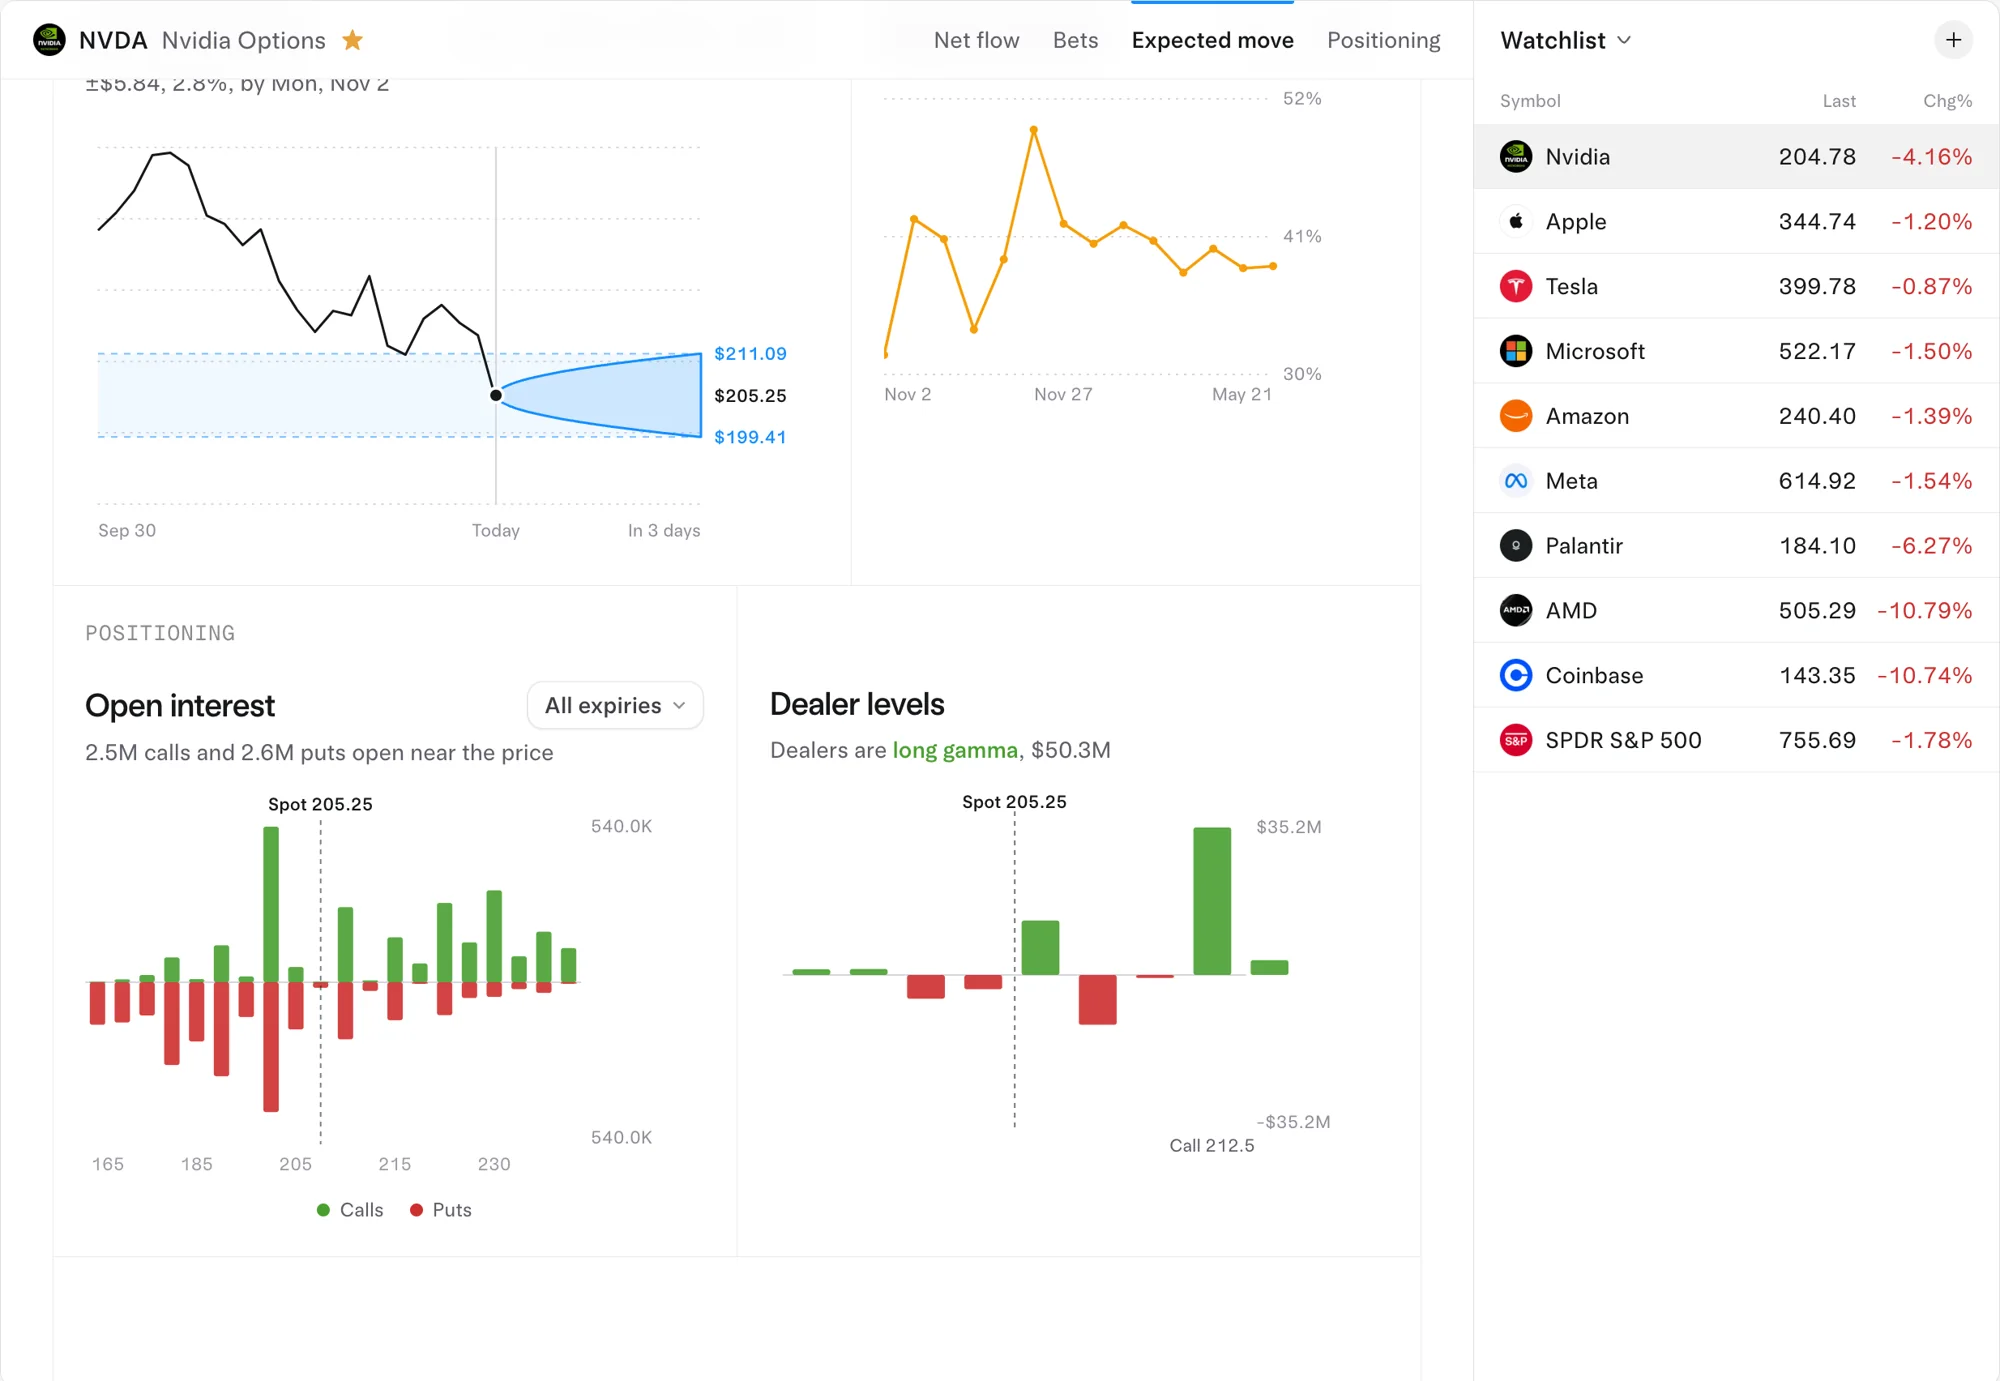
Tabs: Net flow, Bets, Expected move and Positioning.
| Section | What it shows |
|---|---|
| Net flow | Call and put premium through the day, against the stock's price |
| Calls and puts | Calls bought, calls sold, puts bought and puts sold, with the put/call ratio |
| Premium history | Bullish and bearish premium for each of the last 30 sessions |
| Bets by strike and expiry | A grid of premium by strike and expiry, green for bets on a rise, red for a drop |
| Most traded contracts | The day's busiest contracts |
| Largest orders and Unusual | The biggest orders with side, size against open interest and premium |
| Expected move | The move options price by each expiry |
| Implied volatility | IV by expiry (term) and by strike (smile) |
| Open interest | Open contracts by strike, calls against puts, with max pain |
| Dealer levels | Dealer gamma by strike, with the call wall, put wall and gamma flip |
What's on the dark pool page?
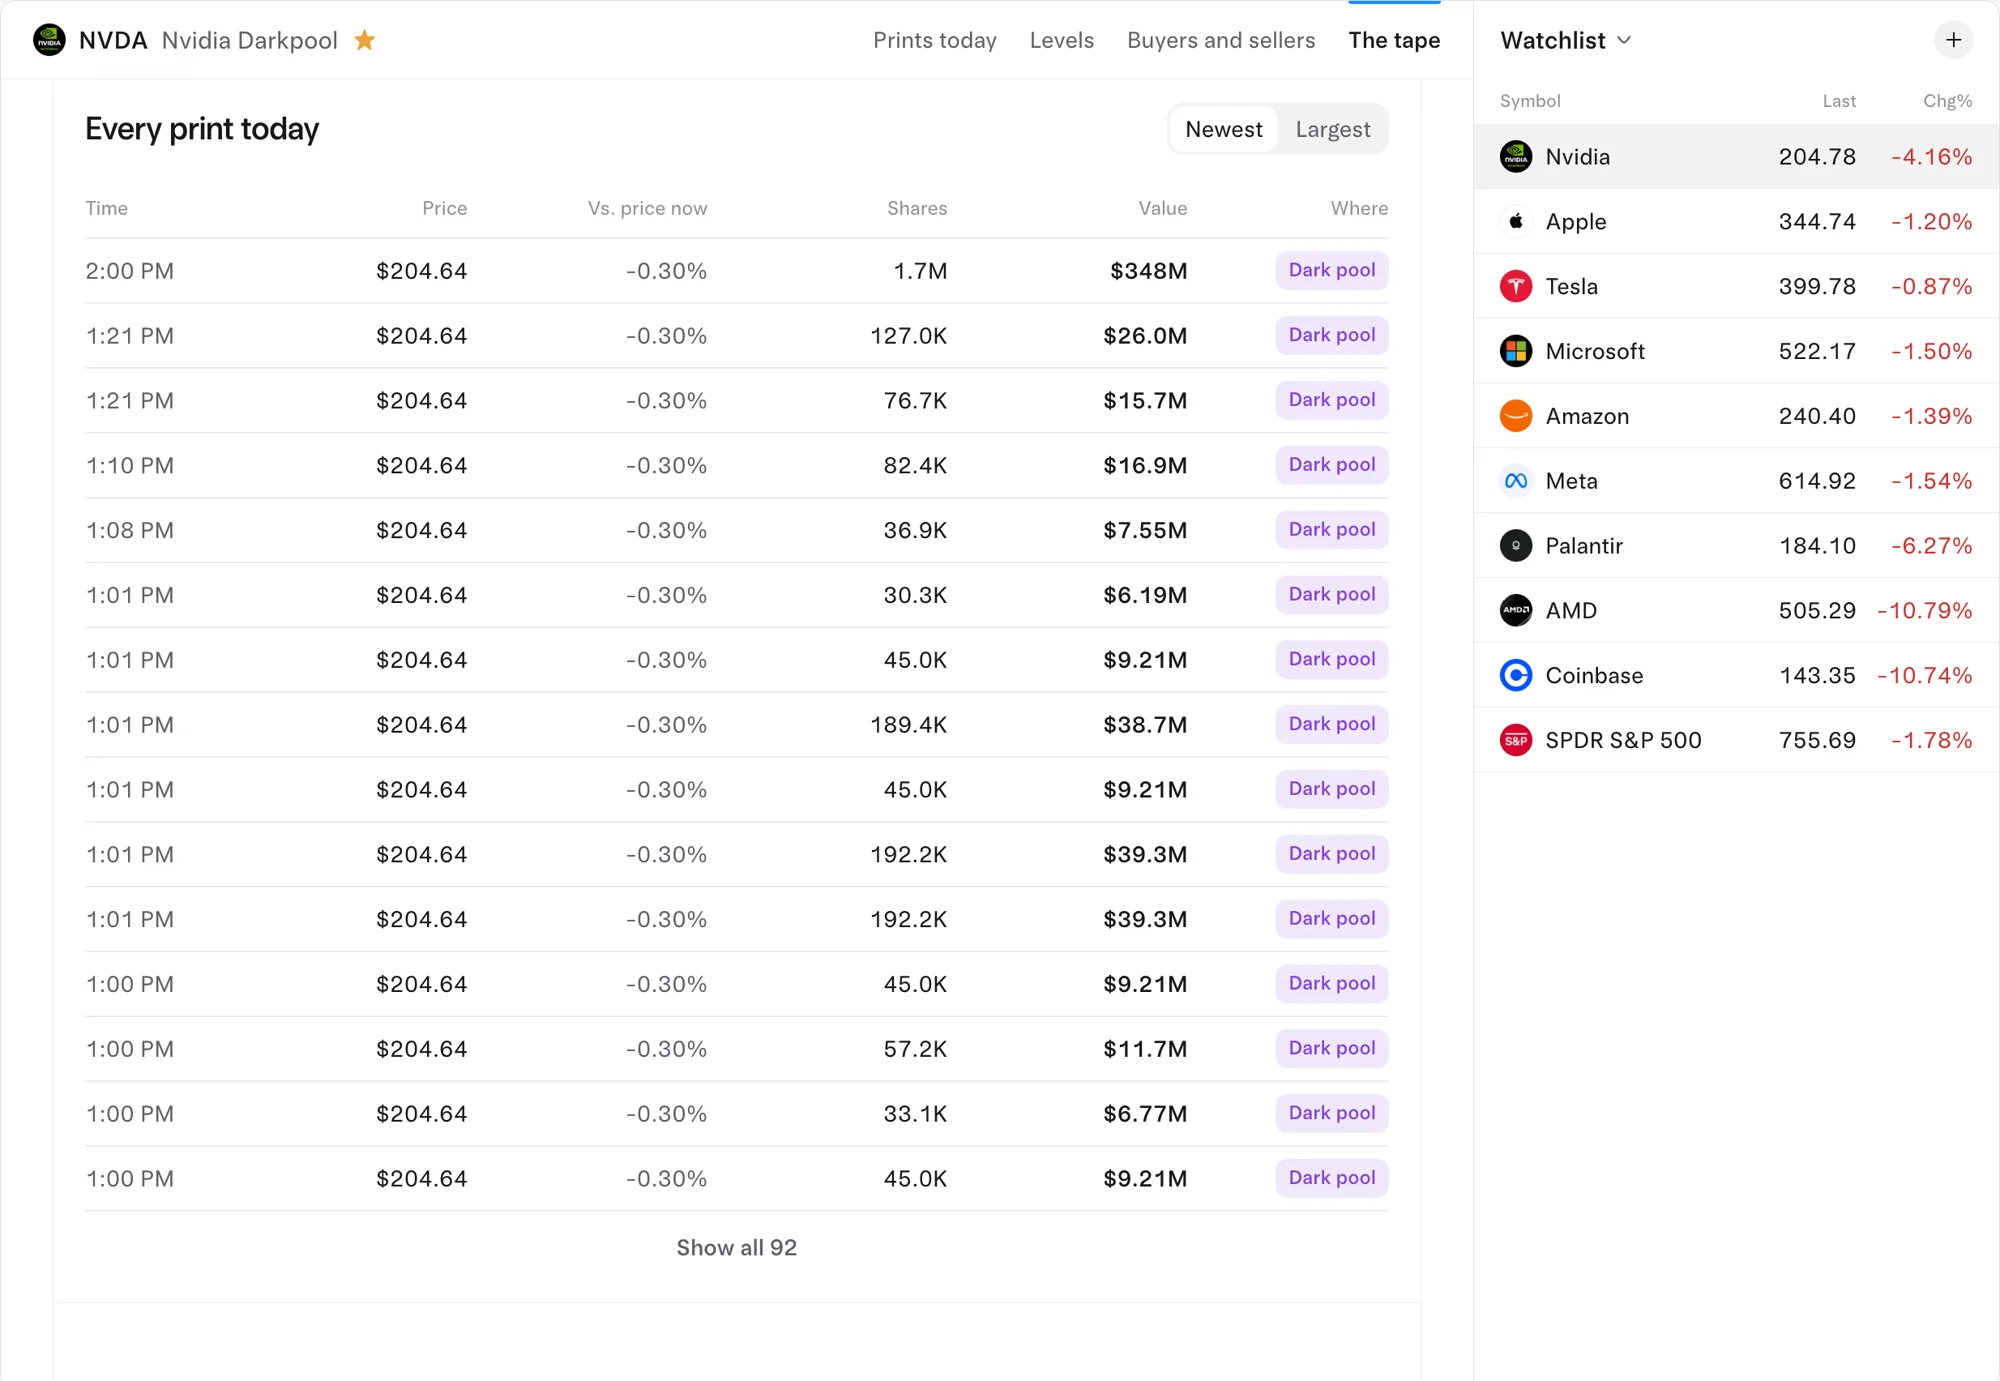
Tabs: Prints today, Levels, Buyers and sellers and The tape. Prints today puts each print on the day's price line as a bubble sized by value. Levels shows the prices where the most dark pool dollars printed over the last 10 sessions. A Traded today card compares the session's dark pool dollars with a usual day, and The tape lists every print with how far its price is from the price now. The full walkthrough is in how to find dark pool prints and levels on Tradytics.
Walkthrough: Apple before earnings, October 30, 2026
On Friday, October 30, 2026, Apple had earnings coming on Monday. Here's the three-page read, in order.
- Stock page. Apple closed at $345.10, down 1.09%. Why it's moving said: "Apple slips 1.1% as investors weigh new Mac launches and Monday's earnings report." The drop was small, and the big event was still ahead.
- Options page. Calls and puts were close to even: calls bought $61.48M against calls sold $60.17M, puts bought $46.19M against puts sold $41.37M, for net premium of -$3.51M. Nobody was leaning hard. The real story was price: implied volatility was 42.4%, up 12.3 points in a day, and the expected move by the November 4 expiry was about $16.49 either way, roughly $328.61 to $361.59. Dealer gamma was positive at $38.15M, so dealers were trading against moves.
- Dark pool page. The three biggest levels of the last 10 sessions sat right around the price: $343.93 ($5.32B in 69 prints), $347.35 ($3.38B in 39 prints) and $344.64 ($2.93B in 45 prints). A usual day is $4.05B. The biggest print on October 30 was the 4:00 PM closing auction on Nasdaq: 12,401,256 shares at $344.63, worth $4.27B.
Put together: the flow had no direction, options were pricing a move of about 4.8% by Wednesday, and big money had been trading heavily right at the current price. For a call or put buyer, the question wasn't direction so much as whether Apple would move more than $16.49, because implied volatility usually falls after earnings and takes option prices with it. That's IV crush, and the expected move is the bar to beat. For more on reading flow into a report, see what big call buying before earnings means.
What does Free show versus Live and Pro?
| Free | Live | Pro | |
|---|---|---|---|
| Price | $0 | $39 a month or $299 a year | $69 a month or $499 a year |
| Stock, options and dark pool research pages | Yes | Yes | Yes |
| Options flow on the research pages | Yesterday's session | Live, to the second | Live, to the second |
| Dark pool prints on the research pages | Yesterday's session | Within about 15 minutes of each print's report | Within about 15 minutes of each print's report |
| AI analyst questions | 3 a day | 20 a day | Unlimited |
Common questions
Which tickers have research pages on Tradytics?
Every US stock and ETF. ETFs work the same way, for example /research/SPY/options for SPY's flow, expected move and dealer levels.
How often is "Why it's moving" updated?
It's written each day by Tradytics' AI for the 100 largest stocks and the most-viewed others.
Where do I find max pain and gamma walls for a stock?
On the options page: max pain is on the Open interest card, and the call wall, put wall and gamma flip are on Dealer levels. See what is max pain, and does it work? and what is gamma exposure (GEX)?
Are the research pages free?
Yes. All three are on the Free plan, with options flow and dark pool prints from yesterday's session.
Can I ask questions about what I'm reading?
Yes. The Chat button on every research page opens the AI analyst, which pulls the same data and answers in plain words.
Sources
- SEC EDGAR full-text search: the SEC's search of company filings since 2001, the primary record behind financial statements and insider filings.
- SEC: Officers, directors and 10% shareholders: insiders must report most trades in their company's stock within two business days, on Forms 3, 4 or 5.
- Options Price Reporting Authority (OPRA): the consolidated last sale and quotation feed from the US options exchanges.
- FINRA: Trade Reporting Facility (TRF): where off-exchange trades are reported.