How to read 0DTE options flow
By Faizan Ahmad. Updated .
Read 0DTE options flow as a live picture of how traders are positioned for today's close, not as a forecast. Watch where same-day premium piles up by strike relative to the current price, whether calls and puts are being bought or sold as the day goes on, and whether dealers are long or short gamma, which tells you if their hedging is more likely to damp moves or add to them. Single 0DTE prints are mostly noise (hedges, premium selling, quick round trips), so weigh the running totals and the levels, not any one alert.
How is 0DTE flow different from regular options flow?
The same columns mean different things when the contract dies at the close. If 0DTE options are new to you, start there.
| What you look at | Longer-dated flow | 0DTE flow |
|---|---|---|
| Time horizon | Days to months | Minutes to hours |
| Volume vs open interest | Size above open interest suggests a new position | Says little: open interest is published once a day before the open, and every 0DTE position is gone by the close anyway |
| Premium filters | A $1M floor catches the serious bets | Hides most of the action, because same-day contracts are cheap; watch contracts traded and the running total |
| Side chips | A useful clue to direction | Still useful, but many prints are closing trades or legs of condors and butterflies |
| What it tells you | A view on the stock over time | Where traders need the price to be by the close |
How do you read 0DTE flow, step by step?
- Start with the levels before the open. Note the day's expected range, the call wall and put wall and the gamma flip. The walls mark where dealer hedging is heaviest, and the flip is where it changes direction.
- Follow the running totals, not single prints. Net premium in same-day calls and puts that builds steadily for an hour says more than one large print.
- Map where the money sits. Strikes just above the price that keep drawing call buying, or just below it drawing put buying, show where traders need the market to go.
- Check the side. Bought at or above the ask leans directional. Mid prints have no lean. Sold at the bid can be a seller collecting decay or a buyer from the morning cashing out.
- Compare with price. If heavy call buying doesn't lift the index, the buyers aren't moving it.
- Reset every day. Yesterday's 0DTE flow expired with yesterday's contracts.
How does dealer gamma shape a 0DTE session?
Near-the-money same-day options carry more gamma than any other expiry, so the dealers on the other side have to rebalance their hedges often as the price moves. When their total gamma is positive, they trade against the move (buying dips, selling rips), which tends to calm the session. When it is negative, they trade with the move, which can stretch it. Positive vs negative gamma covers the mechanics.
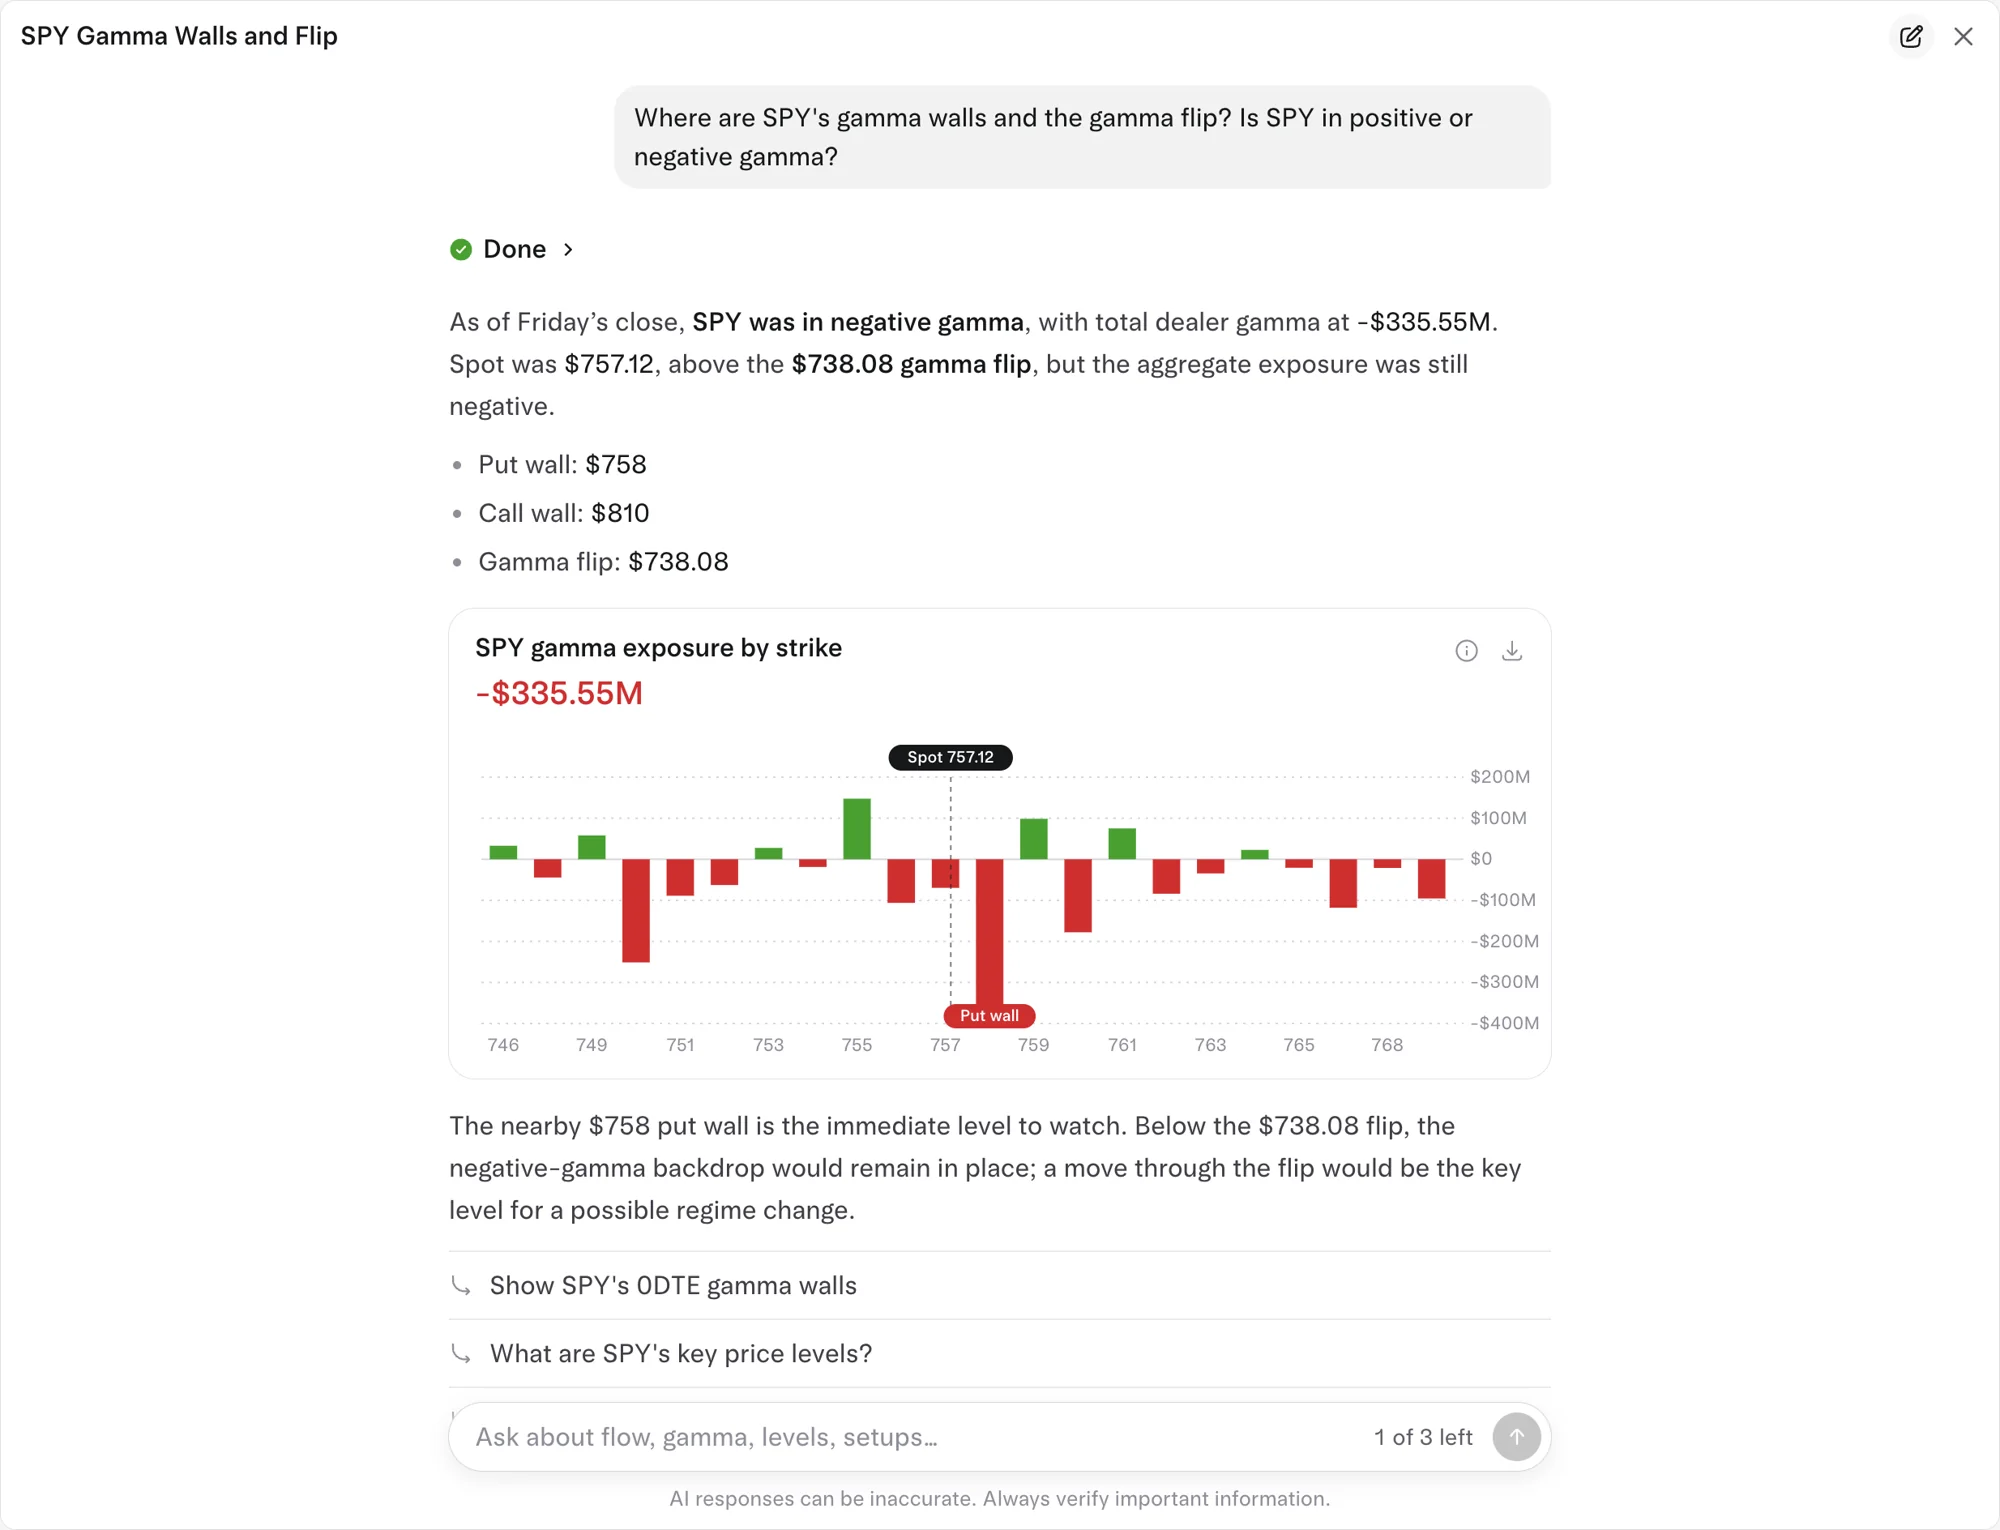
October 30, 2026 shows both what this helps with and where it stops. Tradytics put SPY's total dealer gamma at -$335.55M (negative), and its biggest single strike was $758 at -$364.81M, which was also the put wall. SPY fell 1.59% and closed at $757.12, just under that strike. QQQ's dealer gamma was positive at $180.48M, the setup that usually calms moves, yet QQQ fell 3.16%, twice as much as SPY, because the selling was concentrated in tech: AI chip stocks dropped 9.29% after Intel's weak outlook. Gamma told you where hedging would cluster. It didn't tell you how far the news would push.
How much does 0DTE hedging move the market overall? Less than social media suggests. A study of every SPX trade from July 2020 to June 2023, using Cboe data that shows who bought and who sold, found market makers' combined gamma was usually positive, which damps moves. When it turned negative, volatility was higher, but the largest effect the authors estimated was 3.3 percentage points of annualized daily volatility, a change they don't consider large because moves that size from all causes happen about once a week.
Why are most 0DTE prints noise?
- It is two-way traffic. In that same Cboe dataset, trades where a customer bought a 0DTE option made up 17.2% of SPX volume, and trades where a customer sold one made up 16.0%. Nearly as much selling as buying.
- Retail is about half of it. Cboe estimated retail traders were about 53% of SPX 0DTE volume in August 2025, when same-day trading hit 62.4% of all SPX volume.
- Many prints are legs. Iron condors, butterflies and verticals each print as several legs; read them together, as explained in how to read spreads in the flow.
- Many prints are exits. A same-day put sold at the bid at 2:00 PM may be someone cashing in a hedge bought at 10:00 AM, not a new bullish bet.
How to see it on Tradytics
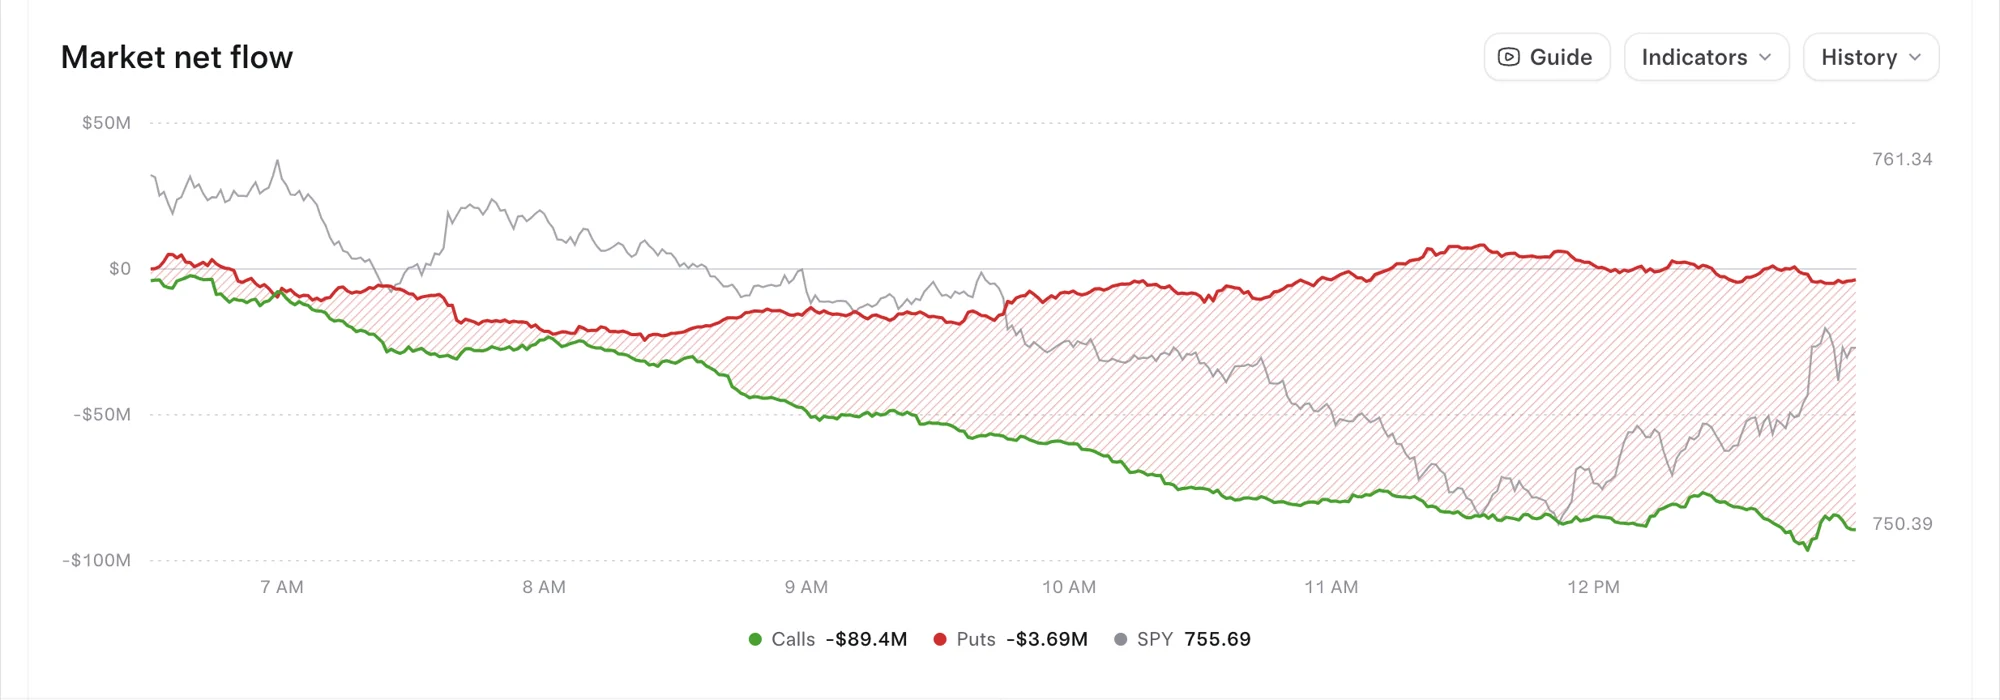
The Options market page has 0DTE flow for SPY, QQQ, IWM and SPX, the market net flow card (call and put premium through the day against SPY), Today's range and Calm day or wild day. Dealer levels by strike, with the call wall, put wall and gamma flip, sit on each research options page, such as SPY options. You can also ask the AI analyst: asked "Where are SPY's gamma walls?", it returned the put wall ($758), call wall ($810), gamma flip ($738.08) and total gamma (-$335.55M). Following 0DTE flow while it still matters takes Live or Pro, where flow is live to the second; Free shows yesterday's session.
Common questions
Is heavy 0DTE call buying bullish?
It leans bullish if the calls are bought at or above the ask and the buying keeps building. Many same-day calls are bought to protect short positions or as legs of spreads, and every one of those trades is over by the close.
Does 0DTE flow predict where the market closes?
Not reliably. It shows where traders need the price to be, which is different from where it ends up. On October 30, 2026, SPY's max pain for that day's expiry was $765, and SPY closed at $757.12; see what is max pain.
Why does SPX flow look so different from SPY flow?
An SPX contract is about ten times the size of a SPY contract and settles in cash, so institutions use it for big hedges. On October 30, 2026, seven of the day's eight biggest options prints were SPX contracts.
Can I use the Free plan for 0DTE?
For study, yes: it shows yesterday's session, including how 0DTE flow and the price moved together. To act on same-day contracts while they trade, you need live flow.
Sources
- Amaya, Garcia-Ares, Pearson and Vasquez, "0DTE Index Options and Market Volatility: How Large is Their Impact?" (January 2025, Cboe): uses Cboe trade records with buyer and seller capacity; market maker gamma usually positive; maximum effect of 3.3 percentage points on annualized daily volatility; customer 0DTE buys 17.150% and sells 15.988% of SPX volume.
- Cboe: SPX 0DTE Options Jump to Record 62% Share in August (September 2, 2025): 0DTE at 62.4% of SPX volume, with retail an estimated 53% of it.
- OPRA Binary Data Recipient Interface Specification (version 6.4b, August 25, 2026): open interest messages are sent once a day, at about 6:30 a.m. ET.
- Most bullish options flow on 2026-11-02: MRVL ($22.86M net), AMZN ($15.80M net), TSLA ($12.03M net), LITE ($6.09M net), PLTR ($4.32M net).
- Most bearish options flow on 2026-11-02: AAPL ($40.91M net), AMD ($20.30M net), MU ($10.61M net), ORCL ($7.99M net), NVDA ($7.77M net).
Updated 2026-11-02 16:04 UTC