How to read the Tradytics options market page
By Faizan Ahmad. Updated .
The Tradytics options market page (/options) sums up the whole US options market on one screen: which way the money is leaning, how big a day options are pricing for SPY, and which stocks and contracts the big bets are going into. Read it top to bottom: the summary line and Market net flow for the lean, Today's setup for the size of the day, then the Money map, Contracts, Sectors, Call bursts and Big movers for names worth a closer look. On Live and Pro it follows the session as it trades; Free shows yesterday's session.
What's on the options market page?
Open Markets, then Options, in the left menu. The page runs in four bands, plus 0DTE flow for SPY, QQQ, IWM and SPX.
| Band | Cards | The question it answers |
|---|---|---|
| Summary | Market sentiment, SPY's likely range today, What traders expect | What's the day in three lines? |
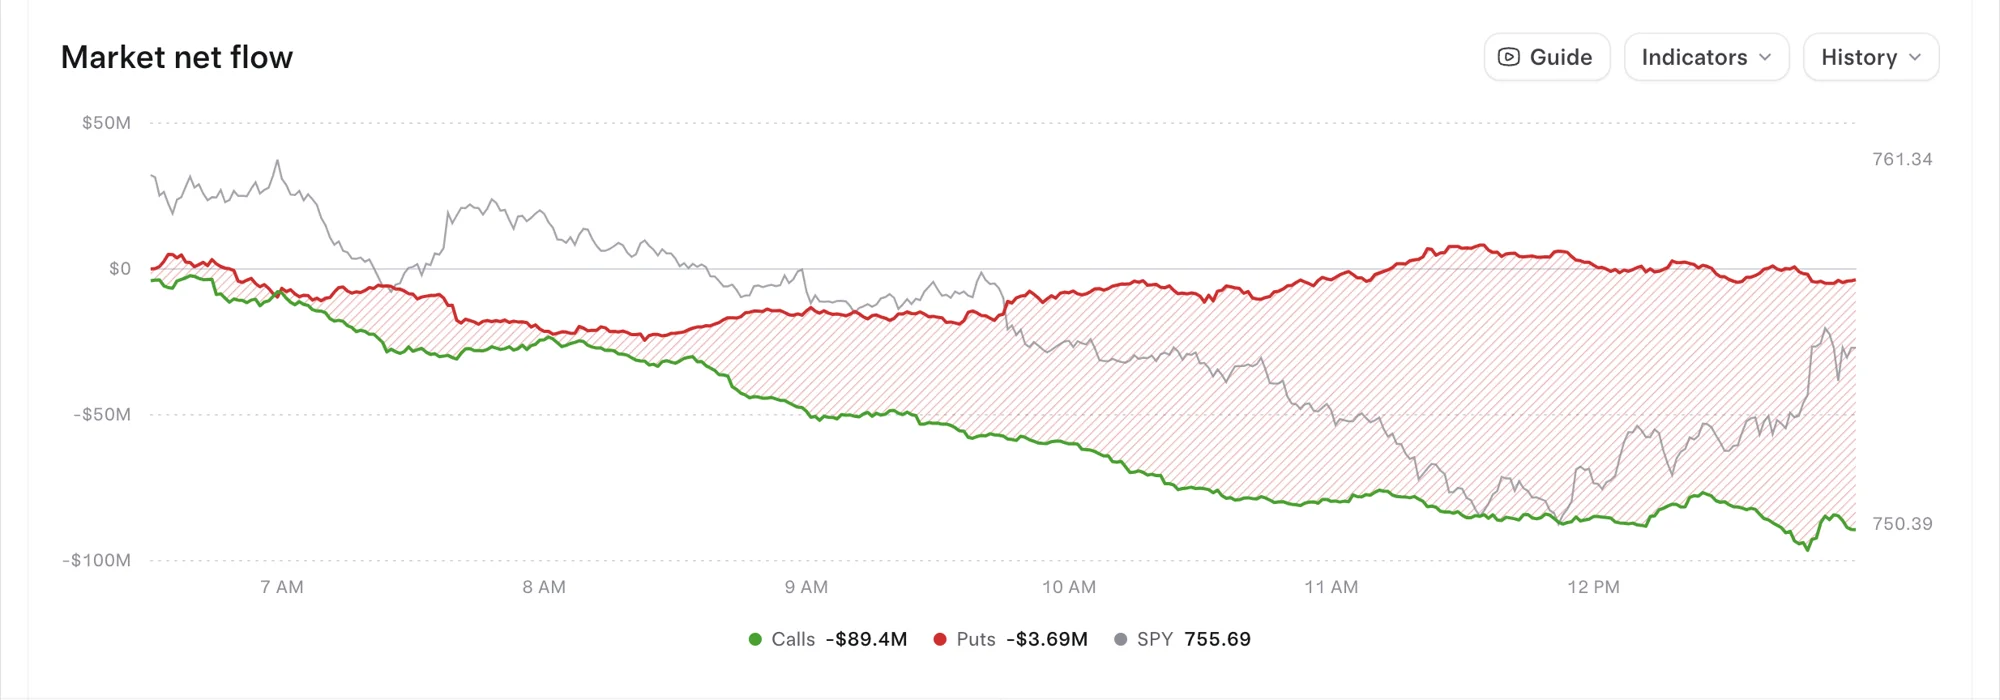
| Market net flow | Net premium in calls and puts through the day, against SPY | Which way is the money leaning, and when did it turn? |
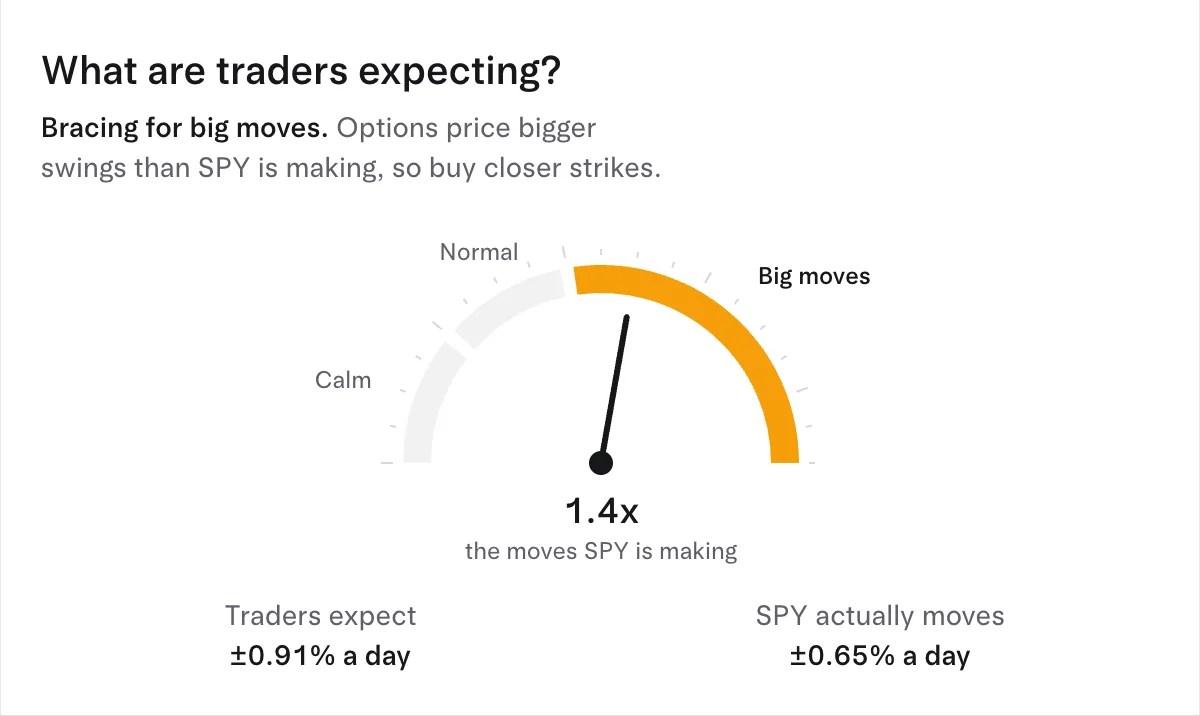
| Today's setup | Today's range, What are traders expecting?, Calm day or wild day?, Tomorrow's bounce signal | How big a day are options pricing? |
| Where the money is going | Money map, Contracts, Sectors, Call bursts, Big movers | Which names and contracts? |
What does each card mean?
| Card | What it shows |
|---|---|
| Market sentiment | Bullish or bearish from net premium so far, and how the day ranks against the last 20 |
| Market net flow | How net premium in calls and in puts built up through the session, drawn against SPY's price |
| Today's range | The range options price for SPY, QQQ or IWM today, and where the price sits in it |
| What are traders expecting? | The daily move options are pricing against the move SPY is actually making, as a ratio |
| Calm day or wild day? | How big a day options price for SPY, QQQ or IWM in points, against a normal day and a calm day, with the move so far |
| Tomorrow's bounce signal | SPY's next-day move after days of light to very heavy 0DTE trading; it only flags a signal after the heaviest days |
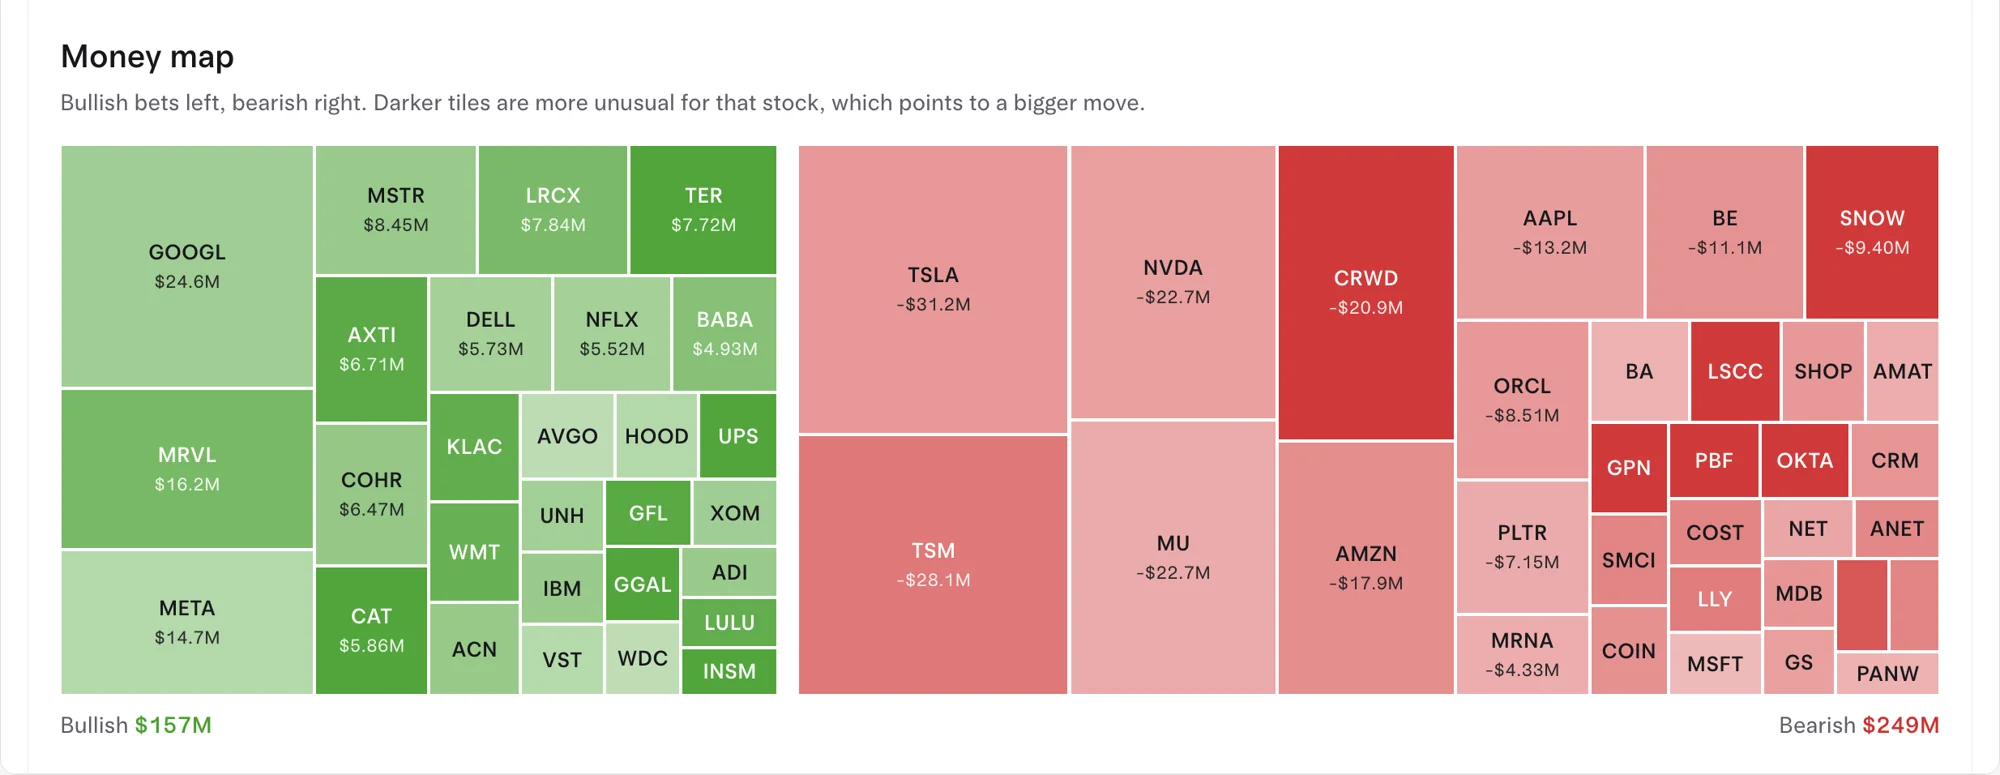
| Money map | A treemap of net premium by stock: bullish bets on the left, bearish on the right, darker tiles more unusual for that stock |
| Contracts | The most traded contracts, with Most active, Cheap, LEAPS and Far OTM views, showing price, volume, Vol/OI and premium |
| Sectors | Net premium by sector, against each sector's usual day |
| Call bursts | Stocks where call buying hit 5 times its normal pace within 15 minutes, with the premium and the stock's move since |
| Big movers | Stocks whose options price a big move either way, often around earnings, with option prices and option trading against normal |
| 0DTE flow | Flow in same-day expiries for SPY, QQQ, IWM and SPX |
A five-minute routine for the options market page
- Read the summary line. Bullish or bearish, and how unusual is that against recent days?
- Look at Market net flow for when the lean formed: at the open, or building all day.
- Check Today's setup. If options price more movement than SPY is making, option buyers are paying up for that day.
- Scan the Money map for the biggest and darkest tiles, then Call bursts and Big movers.
- Take two or three names to their research options page or the flow page to see the prints behind them.
Walkthrough: October 30, 2026
On October 30, 2026, the S&P 500 fell 1.59% and the Nasdaq 100 3.16%, led by tech and AI chips after Intel's weak outlook. Here's what the market's options data said by the close.
- The lean. Large prints totaled $11.84B in calls and $12.72B in puts, for net premium of -$86.53M: a bearish day. The put/call ratio by premium was 1.07, but 1.26 in index options and 0.91 in single stocks, which points to hedging at the index level more than bets against single stocks.
- The size of the day. Options priced SPY to move about $6.93 either way by November 2, at an implied volatility of 12.4%. SPY closed at $757.12.
- Where the money went. The most bullish names by net premium were Citigroup (C, $93.80M net of $215.39M traded, even as the stock fell 2.6%), GOOGL ($58.61M) and MRVL ($31.01M). The most bearish were MSTR (-$44.61M), TSLA (-$32.94M) and AMD (-$28.20M, with the stock down 10.3%).
The one to dig into is Citigroup. Bullish money in a falling stock is a gap worth explaining, and the prints explain it. At 3:18 PM ET, 5,350 contracts of the C December 18 $75 call traded against open interest of only 2,675, for $24.82M, bought at the ask. In the same minute, 4,270 of the $72.50 call ($20.86M) traded at about twice its open interest of 2,133, also bought at the ask. Volume twice the open interest, paid at the ask, means these were most likely new bullish positions. That's the path the page is built for: the market's lean, then the outlier, then the prints behind it on Citigroup's options page.
What does Free show versus Live and Pro?
| Free | Live | Pro | |
|---|---|---|---|
| Price | $0 | $39 a month or $299 a year | $69 a month or $499 a year |
| Options market page | Yesterday's session | Today's session, from flow that's live to the second | Today's session, from flow that's live to the second |
On Free, the page works as a morning read of the session before: what the market leaned toward, how big a day was priced and which names drew the money.
Common questions
Is the Tradytics options market page live?
On Live and Pro, yes. It's built from options flow that's live to the second. Free shows yesterday's session.
What does a bearish market sentiment mean?
Net premium is below zero: more money went into puts bought and calls sold than into calls bought and puts sold. It describes where the money went, not where prices go next. More in what is net options flow (net premium)?
How is the options market page different from the flow page?
The options market page sums the market up in cards; the flow page lists the prints one by one. Start here, then use the options flow page for the trades behind a name.
Where do I see 0DTE flow on Tradytics?
On the options market page, for SPY, QQQ, IWM and SPX. If same-day options are new to you, read what are 0DTE options? first.
What does "Calm day or wild day?" compare?
The size of the day options are pricing for SPY against a normal day and a calm day, in points. A wild day helps call and put buyers because the stock has room to move; the expected move is the number behind it.
Sources
- Options Price Reporting Authority (OPRA): the consolidated last sale and quotation feed from the US options exchanges.
- Cboe: SPX options: Cboe's product page for S&P 500 index options, which offers standard, weekly and daily expirations.