Is a put sweep bullish or bearish?
By Faizan Ahmad. Updated .
A put sweep can be either. It depends on which side was in a hurry. If the sweep filled at or above the ask, someone paid up to buy puts: that's a bearish bet or, very often, insurance on stock they already own. If it filled at or below the bid, someone was rushing to sell puts, and that leans bullish. A sweep at the mid tells you almost nothing. And no flow tool can confirm whether the trade opened a new position or closed an old one.
Why the side matters more than the word "put"
A put gains value when the stock falls, so it's natural to read every put as bearish. But every trade has a buyer and a seller, and they want opposite things. The put buyer wants the stock to drop, or wants protection in case it does. The put seller collects the premium and wants the stock to stay above the strike. The Options Industry Council describes a cash-secured put seller's outlook as a short dip followed by a longer rise, which is neutral to bullish.
The word "sweep" tells you how the order filled: one order taking the best prices on several exchanges at once (more on that in what is an options sweep). It tells you about urgency. The side tells you direction. You need both.
Put sweep bought vs sold: the quick read
| Where it filled | What happened | Usual lean | What else it could be |
|---|---|---|---|
| Above ask, At ask, To ask | The buyer paid up to get puts | Bearish | A hedge on shares they own, or buying back puts they sold earlier |
| Mid | Filled halfway between bid and ask | No clear lean | A negotiated trade or one leg of a spread |
| To bid, At bid, Below bid | The seller hit the bid to get rid of puts | Bullish | Taking profit on puts bought earlier, or selling puts to buy the stock lower |
The "what else" column is why put flow is hard. Selling puts you bought last week looks exactly like opening a new short put. One is a bearish trader cashing out; the other is a bullish bet. For how tools infer the side in the first place, see how to tell if an options trade was bought or sold.
Real put trades from October 30, 2026
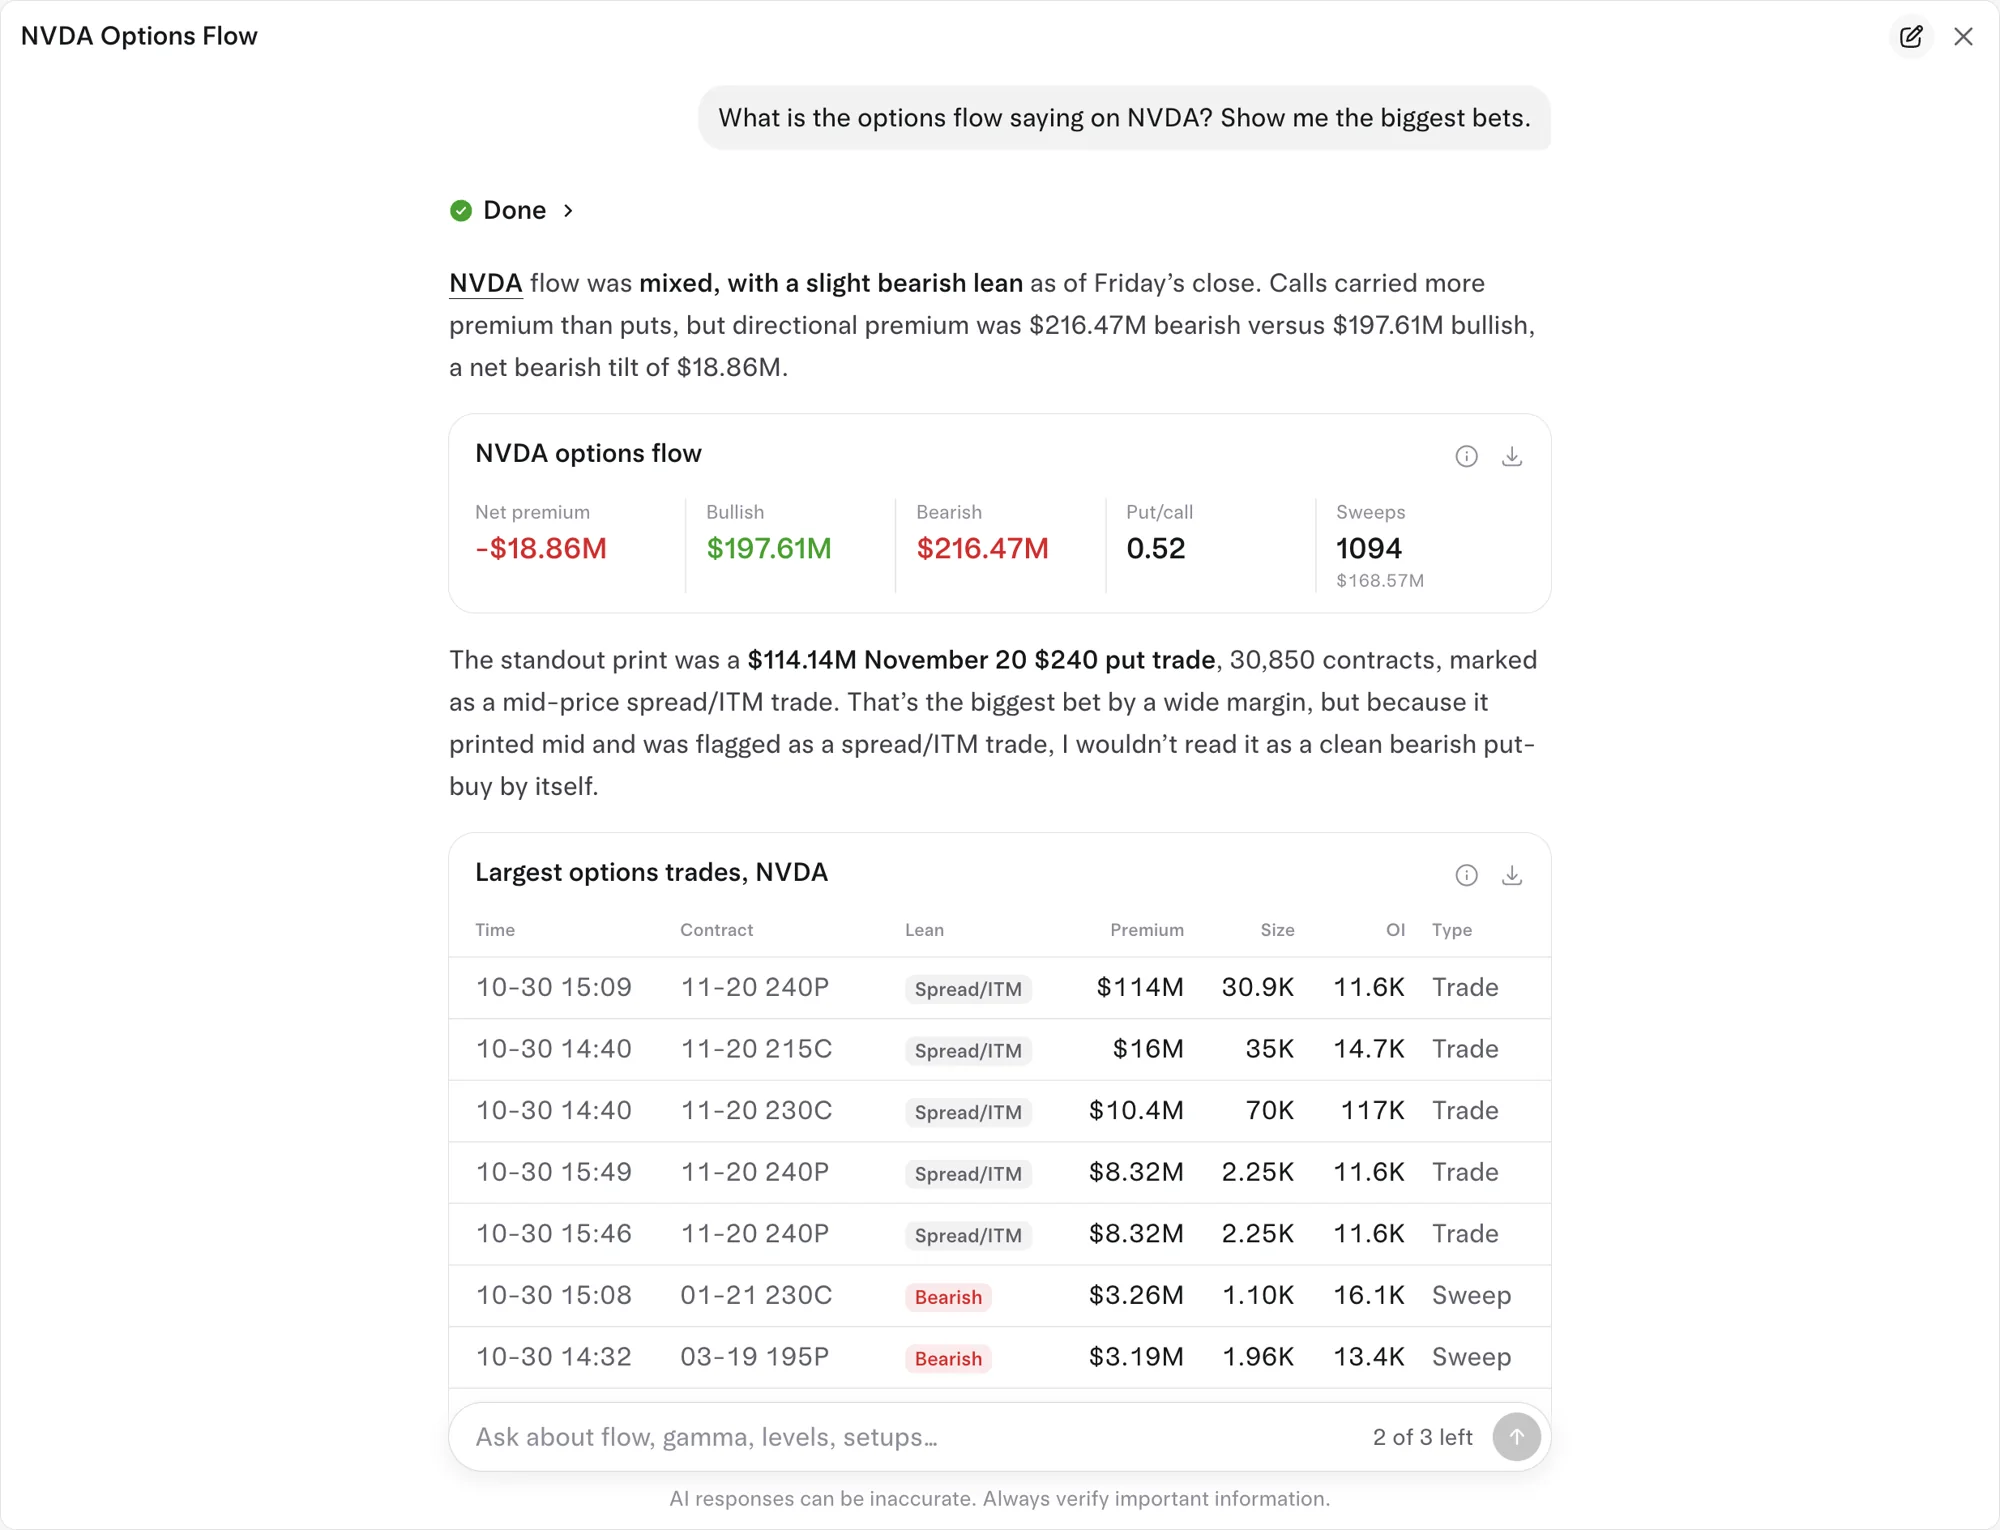
On October 30, 2026, the S&P 500 fell 1.59% and the Nasdaq 100 dropped 3.16%. A down day is when people expect bearish put buying. Three of that day's unusual put trades show why the side decides the read. None of them was labeled a sweep, but the logic is the same for any print type.
- Seagate (STX) November 20 655 put: 1,621 contracts against open interest of 70, $8.71M, sold at the bid. Volume was 23 times the open interest, so at least 1,551 of those contracts couldn't have been closing old positions. Someone sold puts in size: read bullish.
- Alphabet (GOOG) January 15, 2027 275 put: 4,903 contracts against open interest of 2,761, $6.59M, sold at the bid. Again bullish: a seller willing to own the stock at $275 or bet it stays above.
- AMD December 15, 2028 910 put: 170 contracts against open interest of 52, $7.28M, bought at the ask. Read bearish. But look at the strike. With AMD at $507.72, a 910 put is about $402 in the money, and at roughly $428 a contract nearly all of it is intrinsic value. That's not a cheap crash bet. It moves largely with the stock, closer to a short stock position, and could just as well hedge a big AMD holding. AMD fell 10.28% that day.
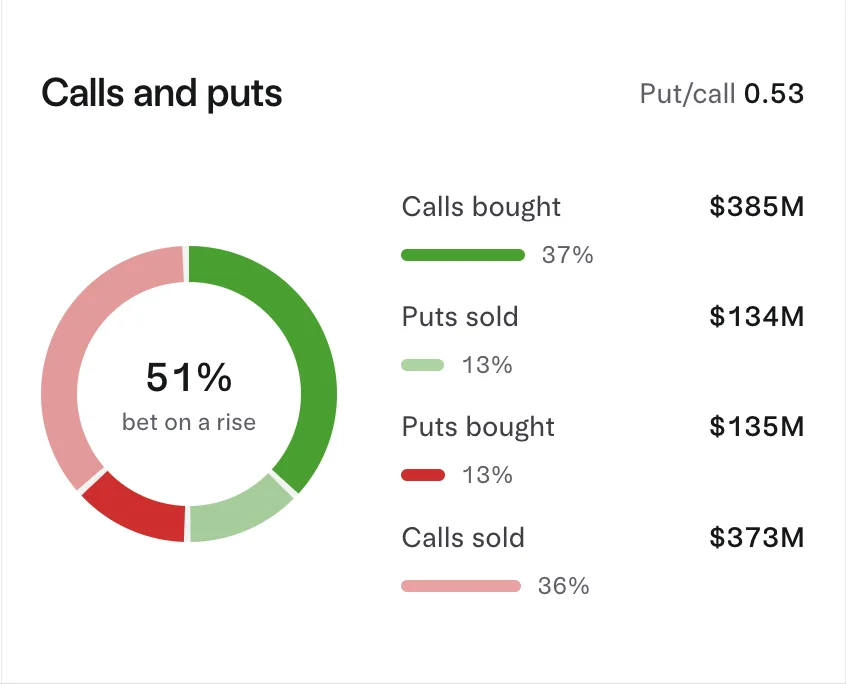
Zoom out to the whole SPY chain and the same lesson holds. SPY fell 1.59%, yet puts sold ($384.30M) outweighed puts bought ($354.12M). That's what you'd see when traders sell puts into a drop, or sell hedges that have already paid off. The flow can't tell you which.
When a bought put sweep is a hedge, not a bet
Buying puts against stock you own is the textbook protective put: the put sets a floor under the shares, and the owner stays bullish overall. Big funds do this constantly, and much of it happens in index and ETF options. On October 30, 2026, the put/call ratio by premium was 1.26 in index options and 0.91 in single stocks. SPY's was 2.26. Put buying in SPY or QQQ is far more likely to be portfolio insurance than a fresh bet against the market.
Signs a bought put is protection: it's on an index or ETF, it's dated months out, it shows up alongside stock buying, or it's paired with calls sold on the same stock (a collar). How to tell if a big options trade is a hedge walks through these in detail.
Four checks before you call a put sweep
- Side. At or above the ask is a buyer; at or below the bid is a seller. Mid gets no vote. The chips are explained in what "at the ask" and "at the bid" mean.
- Size vs open interest. If size beats open interest, at least part of it is new. If not, it may be someone closing. See opening vs closing.
- A matching leg. On October 30, SPY's January 29, 2027 716 put and 605 put each traded 19,170 contracts in the same minute. Alone, the 716 leg looks like $21.80M of bearish bets. With the 605 leg, it's a put spread with capped risk and capped payoff. More in how to read spreads.
- What the stock just did. After a big drop, put selling is often profit-taking on hedges. Before earnings, put buying is often protection through the report.
How to see it on Tradytics
On the Live options flow page, every put print shows a Side chip (Above ask through Below bid), the Type (Sweep, Block, Split or Single), Vol/OI, and tags like Opening and Spread, so you can do all four checks on one row. For one ticker, the calls and puts card on its options page (for example SPY options) splits puts bought from puts sold for the whole day. You can also ask the AI analyst whether a big put trade looks like a hedge, a spread or a fresh bet. Live and Pro show flow live to the second; Free shows yesterday's session.
Common questions
Is a call sweep at the bid bearish?
It leans bearish: someone sold calls in a hurry. It could also be a holder selling calls against shares they own, or closing calls they bought earlier.
Can any tool tell for sure if a put was bought or sold?
No. Flow tools infer the side from where the trade printed against the bid and ask. Exchanges sell opening and closing data separately; Cboe's version, for example, covers only trades on its own four options exchanges.
Does a huge put sweep mean a crash is coming?
No. Large put buying is usually hedging, and a single trade, however big, says nothing reliable about where the market goes next.
Why do put sweeps show up on up days?
Because a rally is when owners add protection after gains, and when traders who sold puts earlier buy them back to lock in profit. Both print as puts bought at the ask, and neither is a bet on a drop.
Sources
- Options Industry Council: Long Put, the buyer's bearish outlook, max loss and breakeven.
- Options Industry Council: Cash-Secured Put, the put seller's neutral to bullish outlook.
- Options Industry Council: Protective Put, puts bought as a floor under stock you own.
- Options Order Protection and Locked/Crossed Market Plan (2009), Section 2 definition of an intermarket sweep order.
- Cboe DataShop: Open-Close Volume Summary, buy/sell and open/close data for trades on Cboe's options exchanges.
- Most bullish options flow on 2026-11-02: MRVL ($13.31M net), AMZN ($10.03M net), GOOGL ($7.83M net), TSLA ($4.39M net), CVNA ($3.08M net).
- Most bearish options flow on 2026-11-02: AAPL ($16.20M net), MU ($11.54M net), NET ($10.00M net), ORCL ($8.61M net), NVDA ($5.48M net).
Updated 2026-11-02 15:13 UTC