How to use Tradytics charts
By Faizan Ahmad. Updated .
Open Charts (tradytics.com/charts), type a symbol, and pick a timeframe in the dock at the bottom, from 1 second to monthly. Add indicators from the Indicators button, draw with the tools on the left, and use the layout button at the top right to show up to four charts at once. Your watchlists and a set of ready-made scans sit in the panel on the right. Charts are on every Tradytics plan, Free included.
What's on the Tradytics charts page?
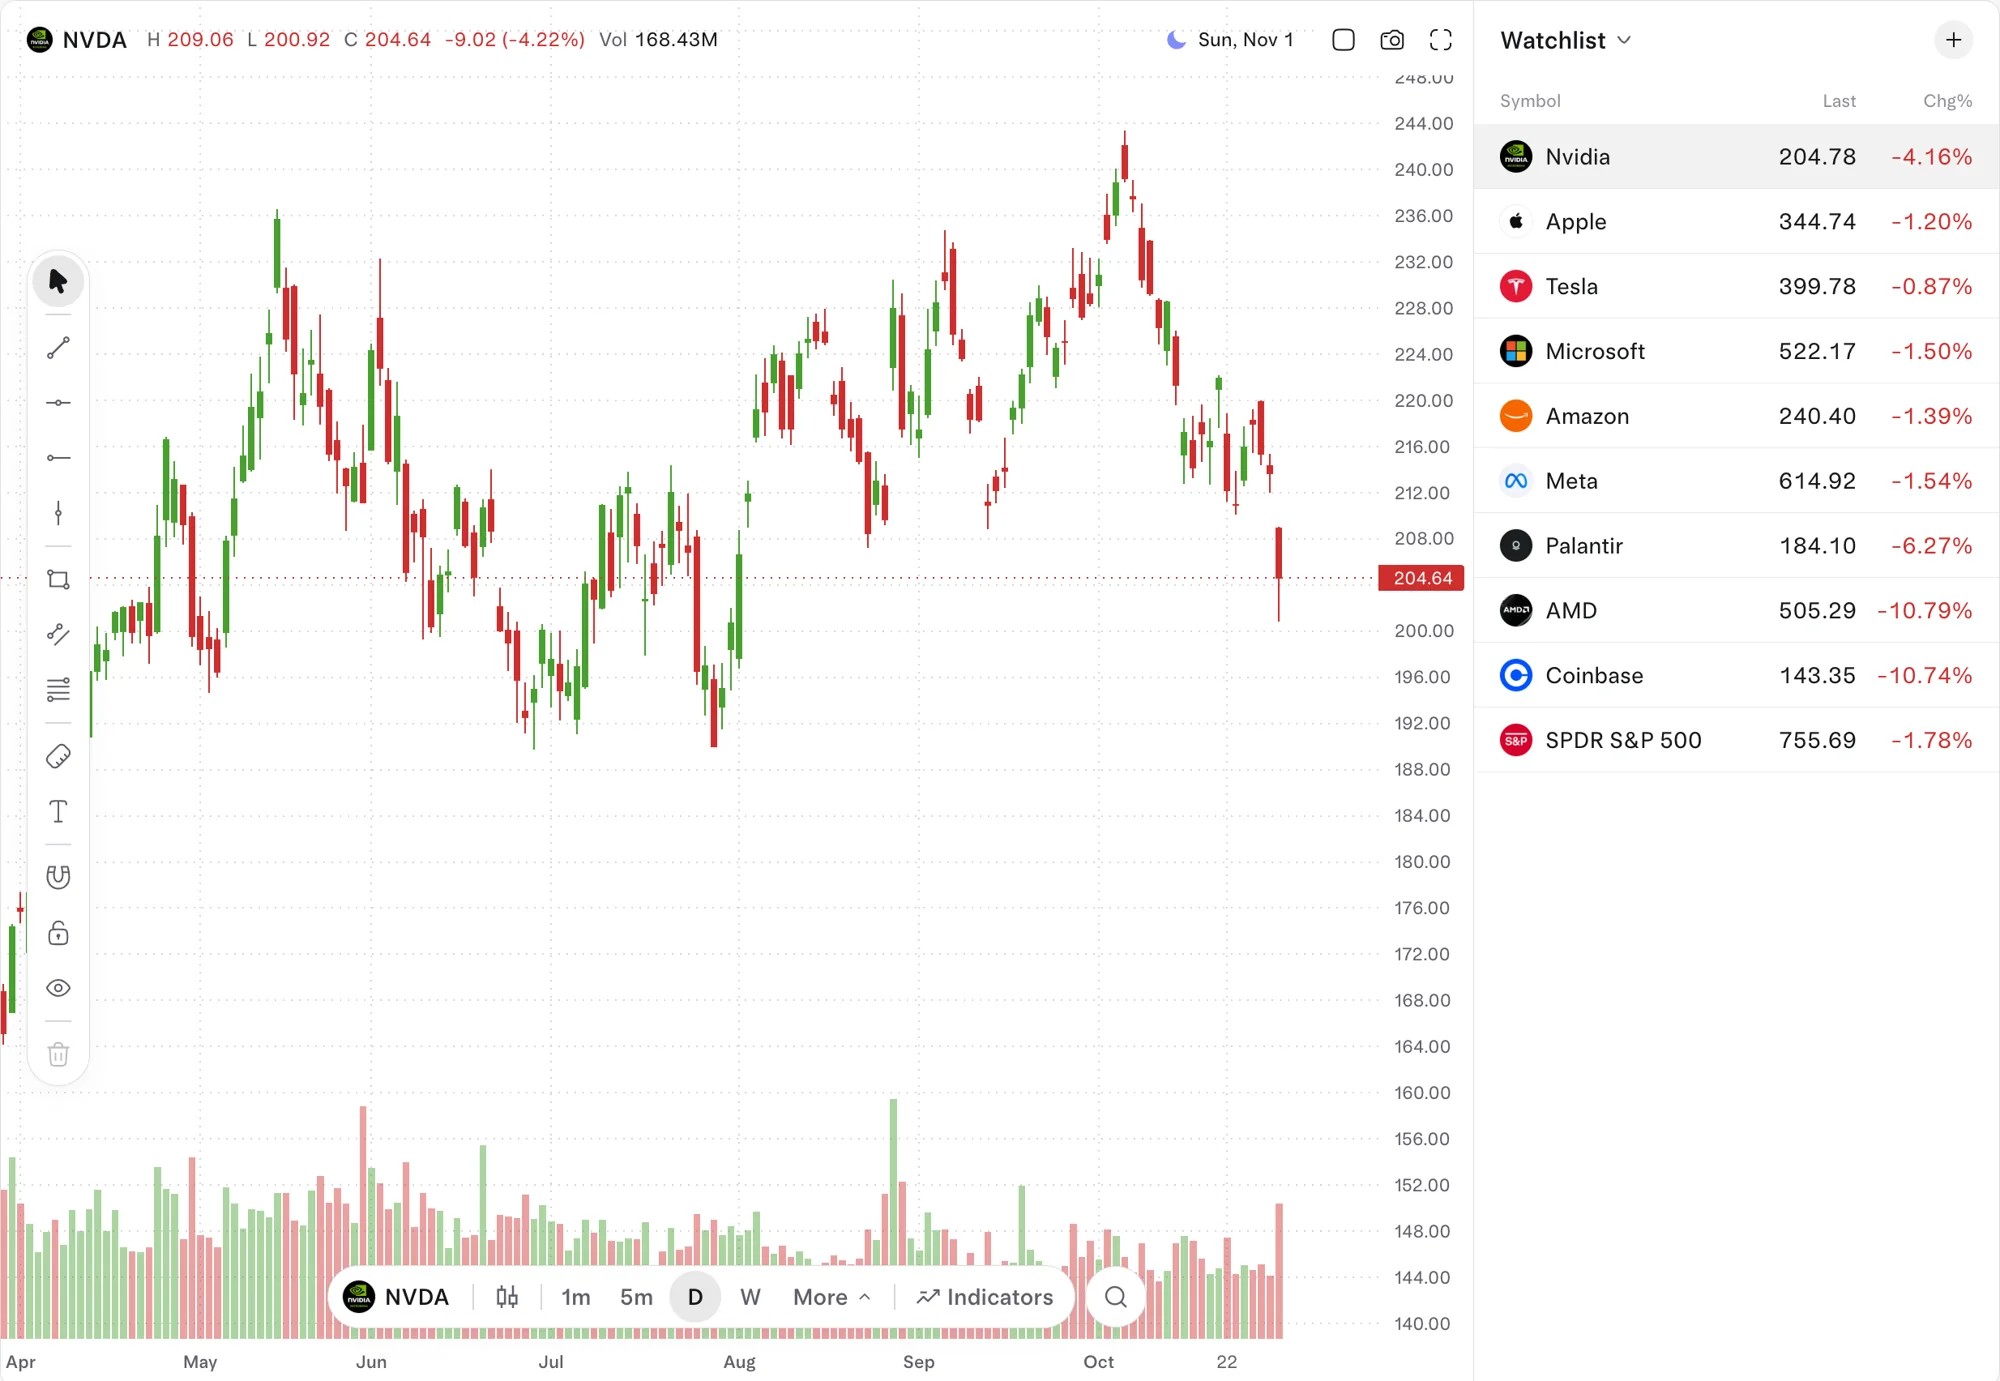
| Part | Where | What it does |
|---|---|---|
| Legend | Top left | Symbol, the bar's high, low and close, the change and volume |
| Session and date | Top right | An icon for the market session (a moon when the market is closed) and the date in New York |
| Chart actions | Top right | Layout (one to four charts), snapshot and full screen |
| Drawing tools | Left side | Lines, shapes, measure and text, plus magnet, lock, hide and remove |
| Dock | Bottom center | Symbol, chart type, timeframes, Indicators, and a search button |
| Watchlist panel | Right side | Your watchlists and scans with last price and change; the menu at the top switches lists |
To change the symbol, click search in the dock or just start typing anywhere on the page. Chart types are candles, bars, line and area. The dock shows 1m, 5m, D and W; More holds the rest: 1s, 15m, 30m, 1H, 4H and M.
Which indicators and drawing tools does Tradytics have?
- Indicators: moving average, exponential moving average, VWAP, Bollinger Bands, RSI, MACD, pivot points, Fibonacci retracement, and support and resistance.
- Drawing tools: trend line, horizontal line, horizontal ray, vertical line, rectangle, parallel channel, Fib retracement, measure (for the size of a move) and text.
- Switches: magnet (snaps drawings to the bars), lock drawings, hide drawings, and remove drawings.
One set of drawing tools serves every chart on the page: pick a tool and draw on whichever chart you like. Lock and hide apply to all of them.
How do you show four charts at once?
Click the layout button at the top right and choose one chart, two side by side, two stacked, three with a large left chart, three with a large top chart, or four. New charts open on the same symbol at different timeframes, so a four-chart layout gives you one stock on several views at once. Click any chart to make it active, then change its symbol, timeframe or chart type from the dock.
The snapshot button copies an image of your charts, drawings included, to the clipboard, ready to paste into a chat or a post.
How do watchlists and scans work on the charts page?
The menu at the top of the right panel lists your watchlists and six scans: top gainers, top losers, most active, gap up, gap down and unusual volume. Click a row to chart it. The plus button opens search to add a symbol to the list. For deeper screens across 120 signals, use the Tradytics scanner.
Worked example: marking NVDA's levels from October 30, 2026
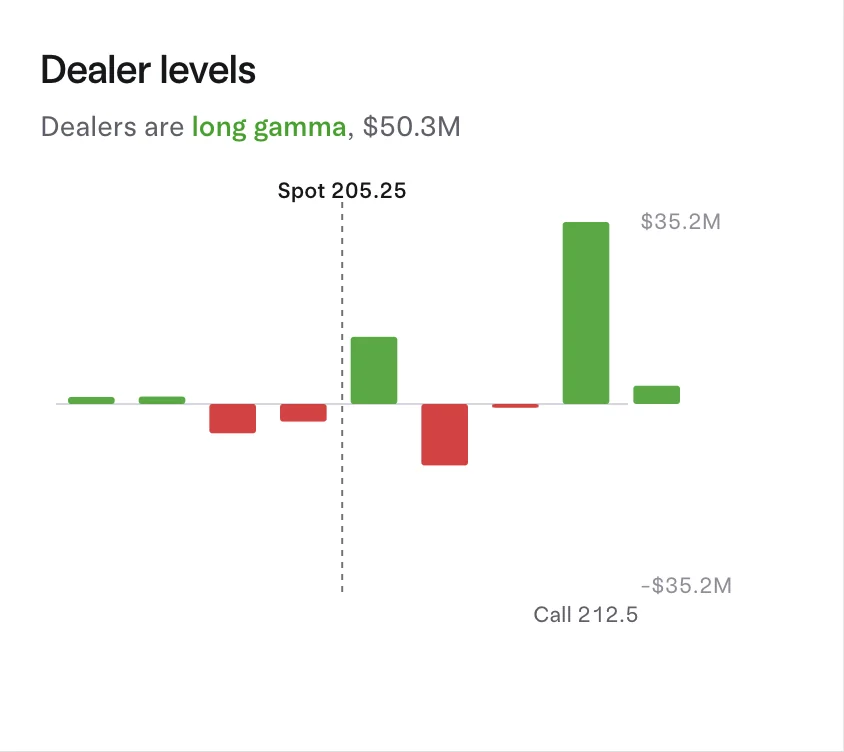
Charts get more useful when you mark the levels options traders and dealers are watching. On October 30, 2026, NVDA's dealer gamma put its call wall at $212.5 and its put wall at $185, and its options priced a move of about $4.77 either way by November 2 (implied volatility 31.4%).
- Open NVDA on the daily chart.
- Pick the horizontal line tool and draw lines at $212.5 (call wall) and $185 (put wall).
- Use two horizontal rays, or a rectangle, for the expected move: the last price plus and minus $4.77.
- Add the biggest levels from NVDA's dark pool page the same way.
- Switch to 5m to watch how price behaves as it nears each line.
These are reference points, not predictions. A wall is where dealer positioning is heaviest, an expected move is what options are pricing, and a dark pool level is where size traded over the last 10 sessions; price can and does go through all of them. To learn what each one means, read call walls and put walls, the expected move and dark pool levels.
A 5-minute daily chart routine
- Open your main watchlist and click through it on the daily chart.
- For anything that moved, switch to a four-chart layout: daily, hourly, 5-minute and weekly.
- Mark the levels that matter today: walls and the expected move from the research options page, dark pool levels from the research dark pool page.
- Check the gap up, gap down and unusual volume scans for names you don't follow yet.
- Before acting on a chart, look at the stock's options flow and ask the AI analyst (Chat button) what the flow and levels say.
Which plans include Tradytics charts?
| Free | Live | Pro | |
|---|---|---|---|
| Price | $0 | $39 a month or $299 a year | $69 a month or $499 a year |
| Charts, research, scanner, gamma, builder | Yes | Yes | Yes |
| Options flow | Yesterday's session | Live, to the second | Live, to the second |
| Dark pool prints | Yesterday's session | Within about 15 minutes of their report | Within about 15 minutes of their report |
| AI analyst | 3 questions a day | 20 questions a day | Unlimited |
Dark pool prints are after-the-fact reports by nature: off-exchange trades are reported to FINRA after they execute, and the biggest are often reported late. They are read for levels built over 10 sessions, not for the second a print happened.
Common questions
Can I see more than one chart at a time?
Yes, up to four. The layout button at the top right offers one, two, three or four charts, and each chart keeps its own symbol and timeframe.
What timeframes do Tradytics charts support?
1 second, 1, 5, 15 and 30 minutes, 1 and 4 hours, daily, weekly and monthly.
Are Tradytics charts free?
Yes. Charts are on every plan, Free included.
Can I share a chart?
Yes. The snapshot button copies an image of your charts, with your drawings, to the clipboard.
How do Tradytics charts compare with TradingView?
Tradytics charts cover the everyday tools in one page next to options flow, dark pools and research. See Tradytics vs TradingView for a full comparison; many traders use both.
Sources
- Options Industry Council: Volatility & the Greeks, defining implied volatility as how much the market expects a price to move, the basis of the expected move.
- FINRA: OTC (ATS and Non-ATS) Transparency, on FINRA publishing off-exchange trading data on a delayed basis.