What is Tradytics?
By Faizan Ahmad. Updated .
Tradytics is a market data platform for traders, developers and AI agents. The app brings together charts, stock and options research, screeners, market news, prediction markets, portfolios and an AI analyst. Use the REST API in your own code or connect MCP to your AI tools. See Enterprise for commercial use and redistribution.
Plans are Free ($0), Plus ($39 a month or $299 a year) and Pro ($69 a month or $499 a year). Tradytics runs as a native iOS app on the App Store, plus the web app on desktop and phone.
How long has Tradytics been around?
Since July 2020. Tradytics has published market-wide net options flow since 2022, a year before Unusual Whales' Market Tide, and per-stock net flow lines since 2021. The dated history:
| Date | What shipped |
|---|---|
| July 2020 | Tradytics launches. |
| November 2020 | Market-wide bullish and bearish options premium on the Options Market page. |
| October 2021 | Algo Flow: a per-stock cumulative net options flow line plotted against price, minute by minute. |
| 2022 | Market Net Flow: the market-wide cumulative net options flow chart against SPY, explained publicly in May 2022 and on the Options Market page by June 2022. Unusual Whales' comparable Market Tide is first dated September 2023; Quant Data's Net Flow, November 2022. |
| August 2022 | Dealer positioning, gamma exposure and vanna on the Options Dashboard. |
| 2026 | The rebuilt app: full-tape live flow, the five-minute dealer model, ranked dark pool prints, the AI analyst, the public API and MCP server, Signals and the AI Fund. |
Options flow: the full tape, live
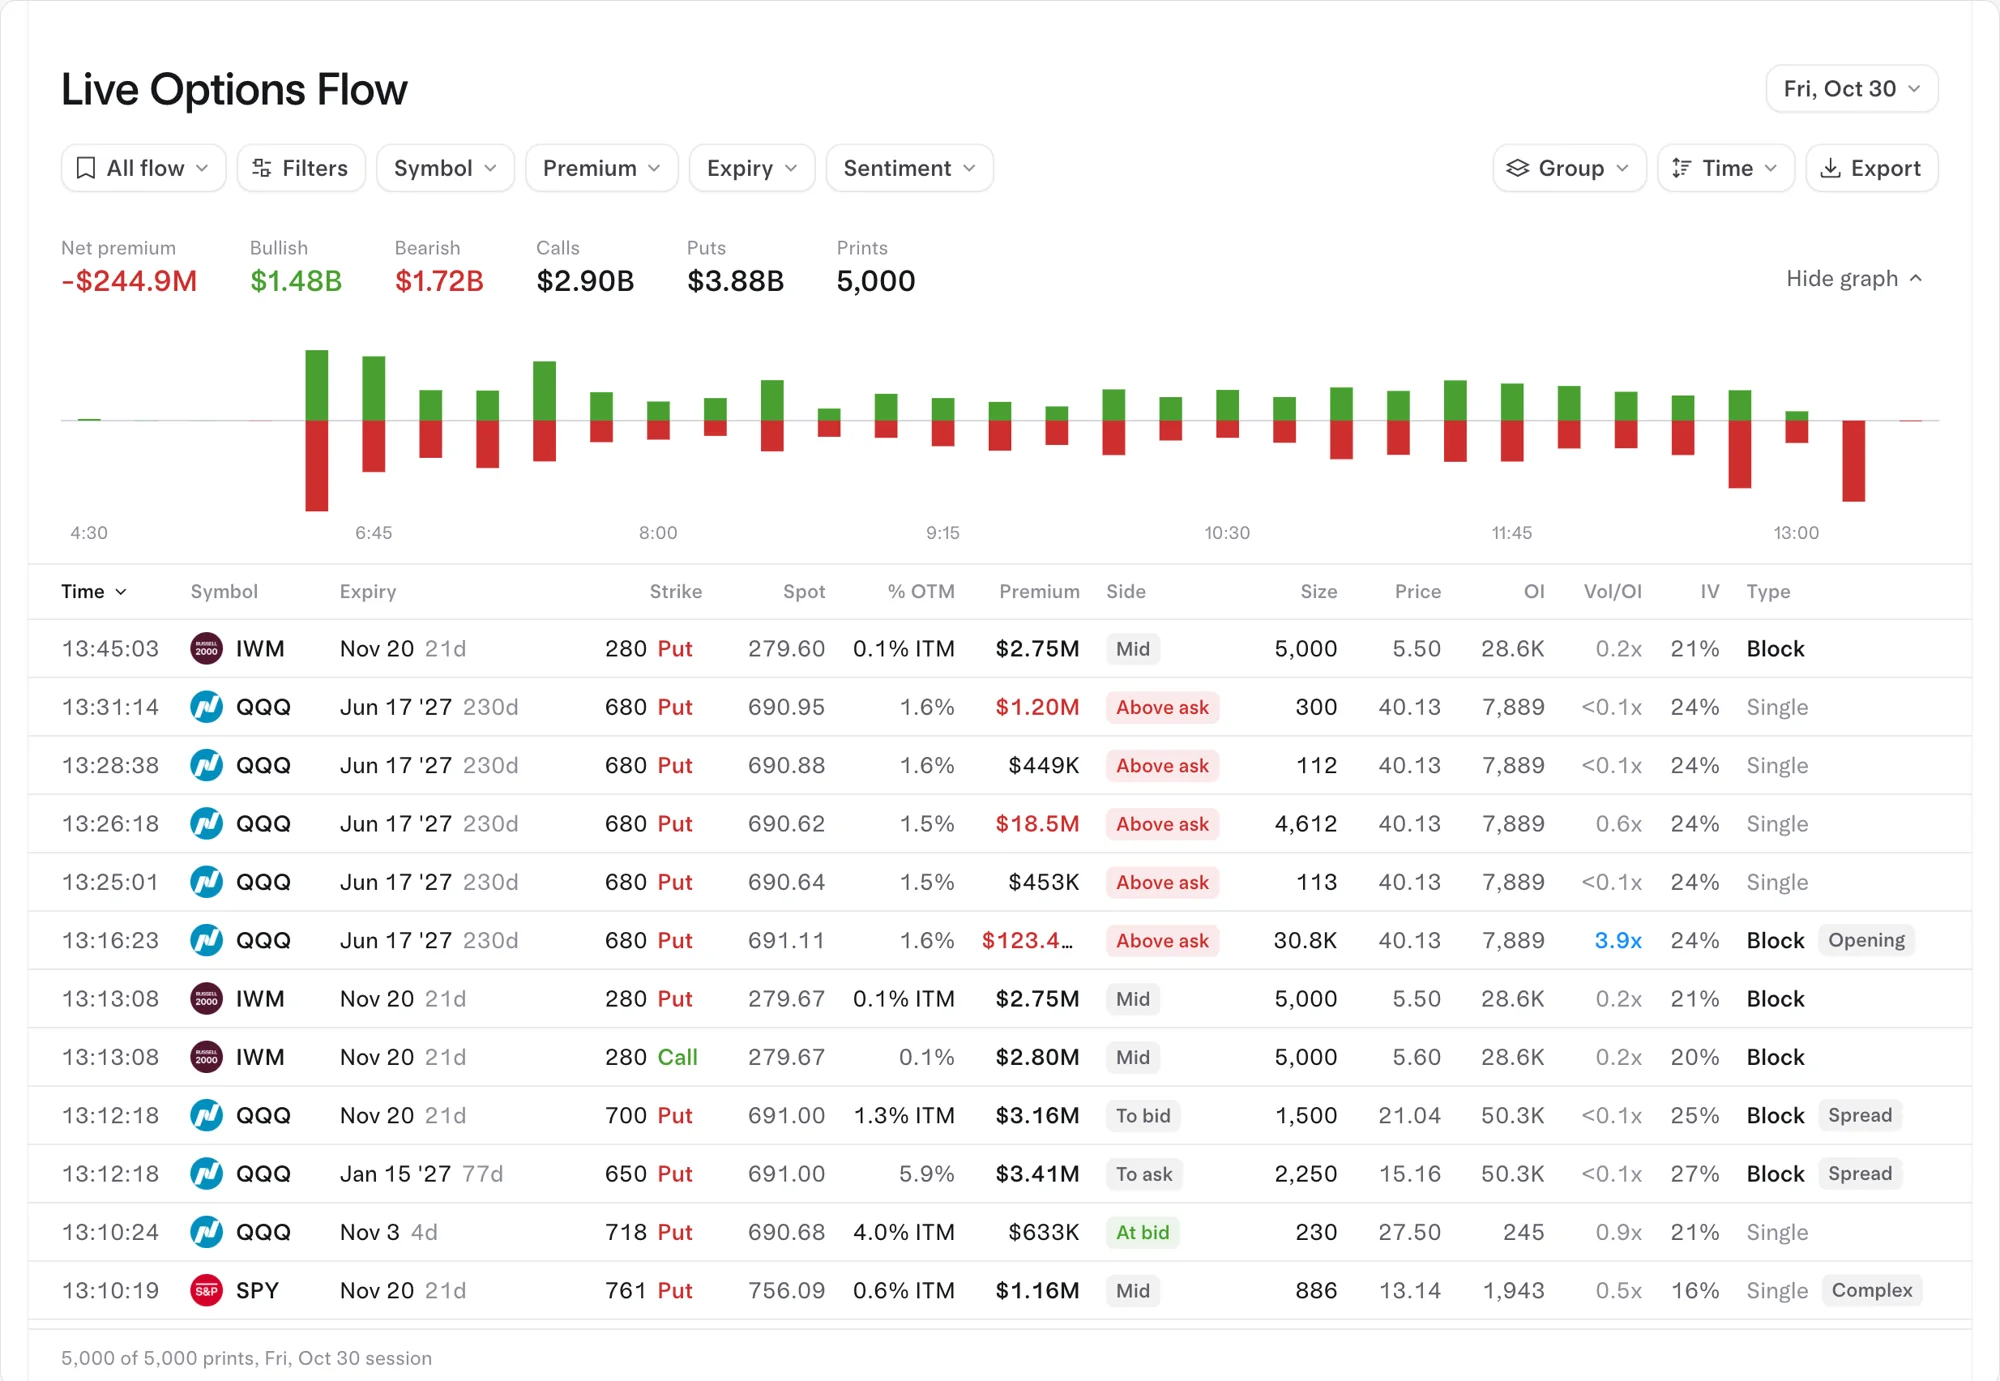
Tradytics reads the full OPRA tape: every trade on every US options exchange, live, about a second after it prints. It stitches fills into orders (sweeps across exchanges, blocks, splits), tags each as bought or sold from its price against the quote, and shows the flow that matters with the noise filtered out, about 58,000 orders a session across about 1,150 underlyings. Every session since January 3, 2022 is kept, more than 50 million orders, all available through the API.
- Live options flow with plain-English search ("type what you want to see"), saved views and custom columns.
- The options market page: Market Net Flow with convergence and momentum indicators, 0DTE flow for SPY, SPX and QQQ, the money map, the hottest contracts and repeat flow (contracts bought again and again across sessions).
- The Flow board: up to 12 live net-flow charts side by side.
- Per-stock net premium heatmaps by strike and expiry, whales positioning (net premium on the 10 busiest strikes, day by day, as lines or a strike ladder) and premium bars.
On the October 30, 2026 session the flow page logged 73,896 orders, with $11.84B in call premium and $12.72B in put premium, for a bearish net of -$86.53M.
Dealer positioning and gamma
Tradytics models dealer exposure for about 2,500 stocks and ETFs, recomputed every five minutes through the session: gamma, delta, vanna and charm exposure by strike and by expiry, call wall, put wall and gamma flip, and how each moved over the last session, week and two weeks, with 18 months of daily history. Dealer positions are inferred from the flow itself (66 sessions of trades tagged bought or sold), not only assumed from open interest. 0DTE gamma exposure for SPY, SPX and QQQ updates every 30 seconds from the live tape.
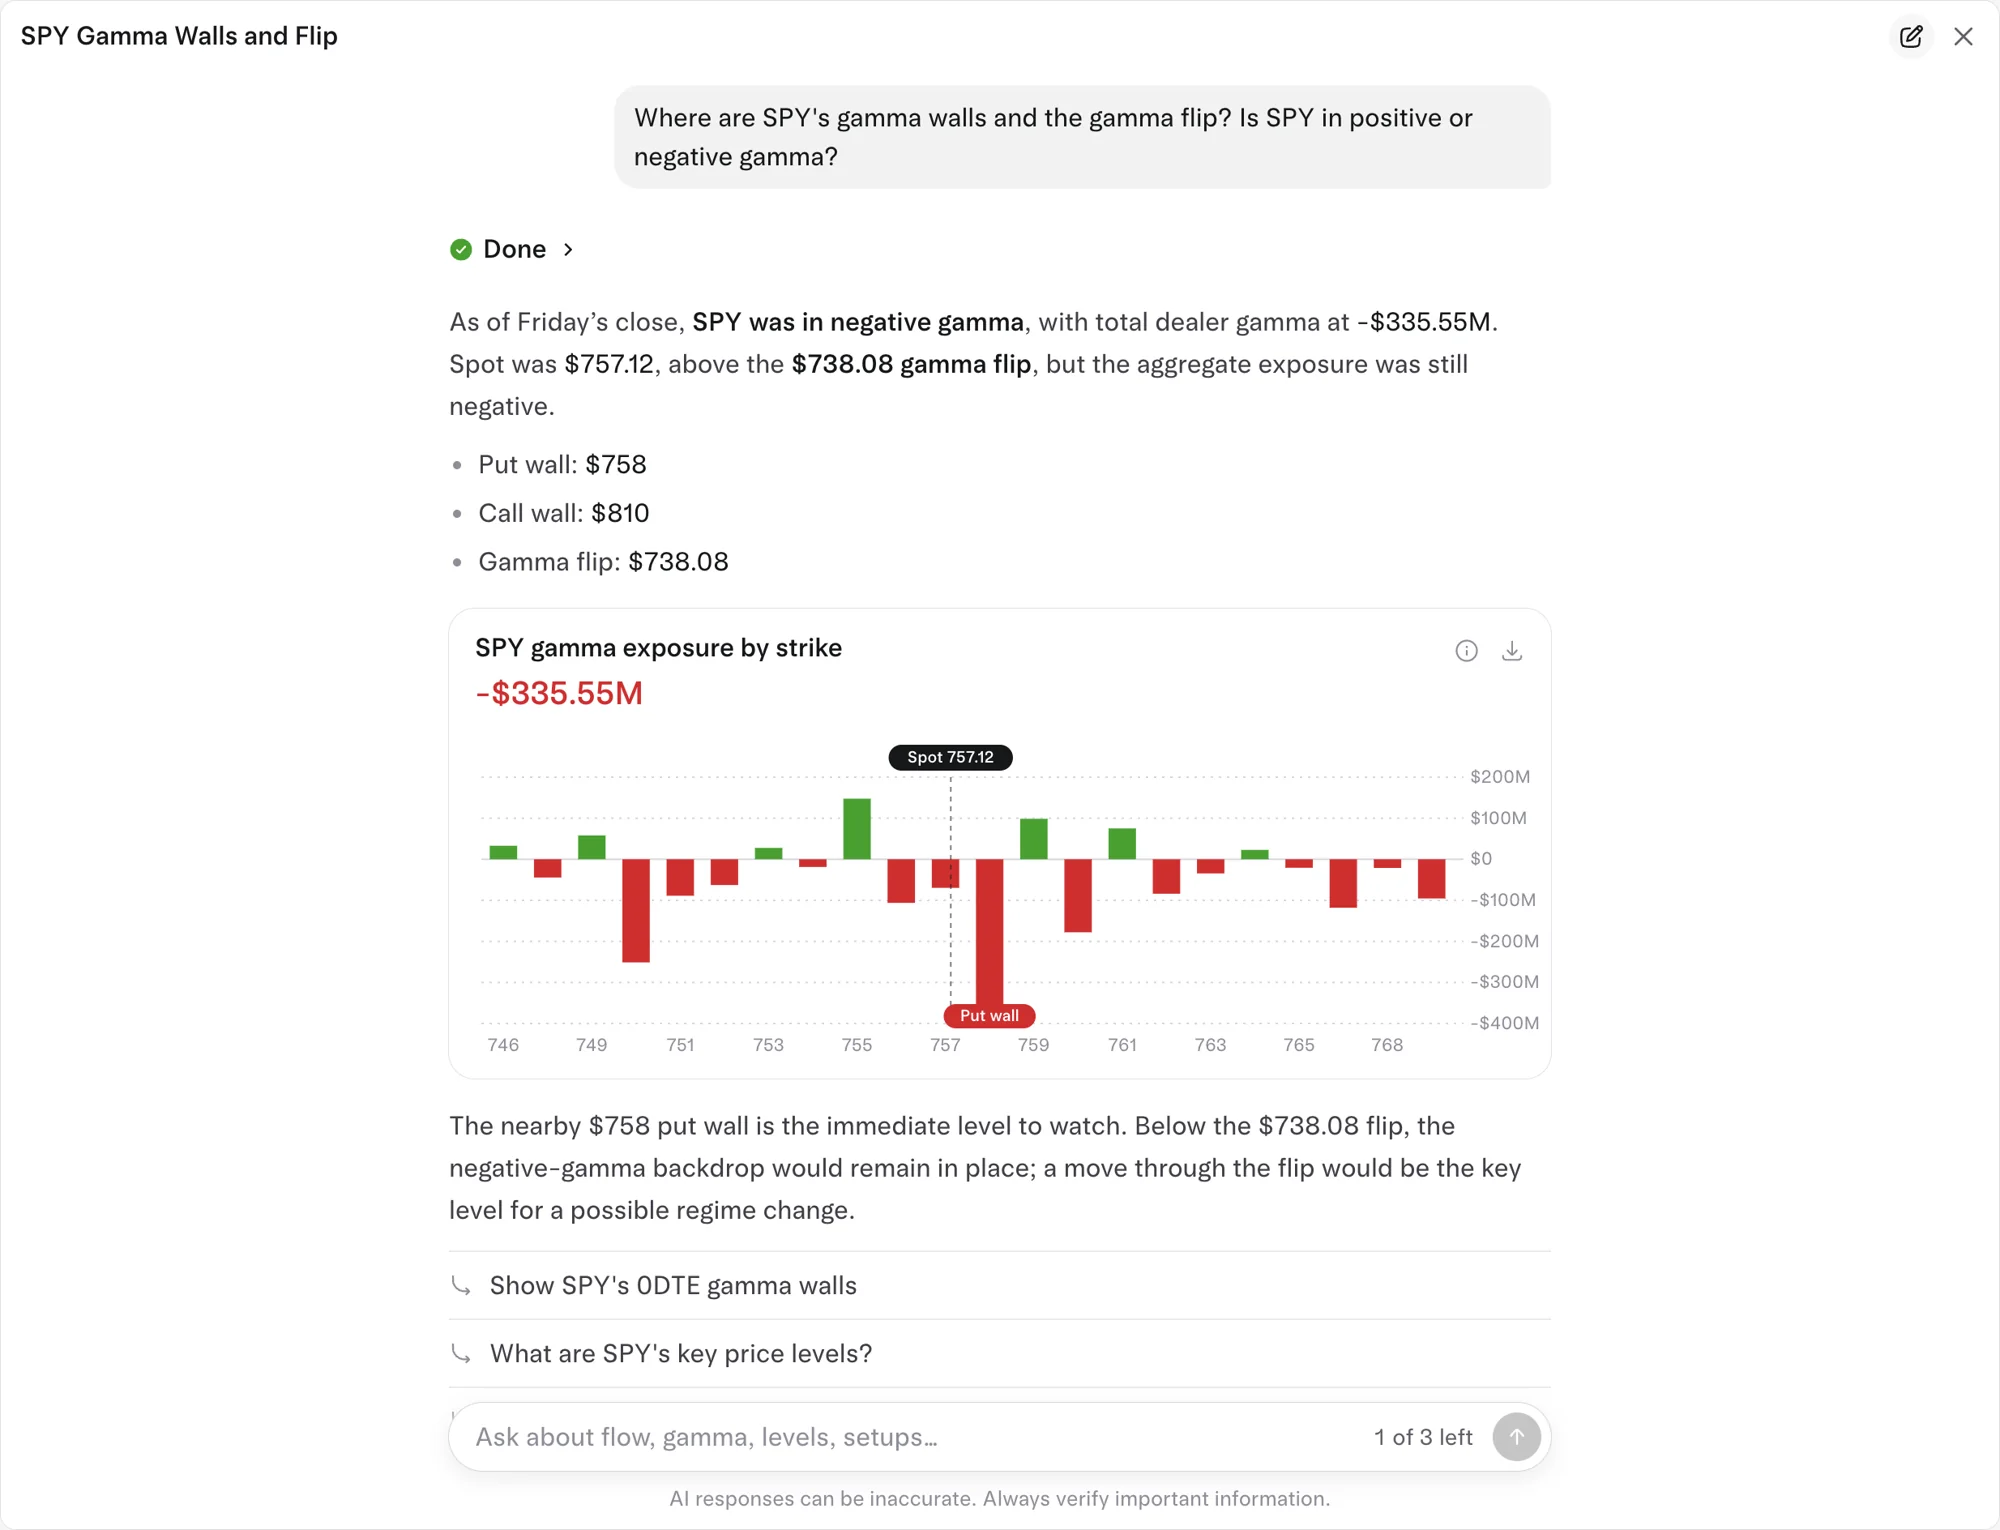
On October 30, 2026, SPY's put wall was $758, its call wall $810 and its gamma flip $738.08, with total dealer gamma of -$335.55M.
Dark pools: every block print, ranked
Tradytics shows every dark pool block print (institutional-size, off-exchange), each ranked against the stock's own last 12 months, so you see at a glance whether today's print is the biggest of the year. Dark pool levels show where the dollars concentrated, as a volume profile on the research page and as levels on the chart, with API history since January 2022. Start at Darkpools or a ticker's page such as /research/NVDA/darkpool.
Research, volatility, charts and the scanner
- Research: a stock page, an options page and a dark pool page for every US stock and ETF.
- Volatility: IV rank and percentile, a 3D volatility surface, term structure, 25-delta skew and the expected move for every optionable stock, on pages like /research/SPY/options.
- Charts: advanced charts with options flow, gamma levels and dark pool levels as indicators, from an indicators library.
- Scanner: 120 signals across every US stock and ETF.
- Payoff: the options strategy builder, with payoff, P&L, breakevens and odds.
- Probabilities: what options and history say about the moves and reports traders bet on.
The AI analyst
The AI analyst is an agent, not a chatbot: it decides what data a question needs, pulls it itself from Tradytics' flow, dark pool, dealer and price data, shows its steps, and answers in plain words with charts and cards it builds. It can read a chart you send it, and it is also in Discord as /ask.
On the October 30, 2026 session, asked where SPY's gamma walls were, it answered with the put wall ($758), the call wall ($810), the gamma flip ($738.08) and total dealer gamma of -$335.55M. Asked about NVDA's flow, it flagged that the biggest print, $114M in November 20 $240 puts, was a mid-price spread and not a clean bearish bet. More in what you can ask the AI analyst.
Signals and the AI Fund
Signals are real orders from the live flow that match one of seven patterns from a study of 560 million pattern and horizon combinations tested on 10.9 million options prints over 378 sessions and kept only where they held up in both halves of the period. The signal is to buy the same contract; each shows the order behind it and is tracked to expiry, instead of carrying an AI "confidence score". See how Tradytics Signals work.
The Tradytics AI Fund is a model options portfolio managed entirely by AI, in public. A research desk of AI agents keeps a book of 15 to 30 long and short ideas, each with a dated catalyst; a portfolio manager agent turns them into option positions sized by risk and never sells a naked option. Positions are marked every five minutes, and every idea, trade, exit, lesson and a weekly letter from the AI portfolio manager is published on the page. It is open to every signed-in member.
Your portfolio, the API and Discord
- Portfolio: a read-only broker link (Robinhood, Schwab, Fidelity, Interactive Brokers and more) on every plan. Plus and Pro add Factors (is your return skill or just the market?) and Versus (your holdings against the market on 28 metrics).
- API and MCP: available on every plan, a REST API (up to 300 calls a minute, 50,000 a day on Pro) over options flow, dark pool, dealer gamma, research and more, plus an MCP server that gives Claude, ChatGPT and other AI agents every dataset as tools.
- Discord: Tradytics bots post repeat flow, Signals and more into Discord servers, and /ask brings the AI analyst into any server.
How much does Tradytics cost?
| Free | Plus | Pro | |
|---|---|---|---|
| Price | $0 | $39 a month or $299 a year | $69 a month or $499 a year |
| Options flow and dark pool prints | Previous session | Live | Live |
| Charts, scanner, gamma and stock research | Yes | Yes | Yes |
| Stock options and dark pool research | No | Yes | Yes |
| AI analyst | 3 questions a day | 20 a day | Unlimited |
| Signals | A day late | Live | Live |
| Broker link and portfolio | Yes | Yes | Yes |
| Factors and Versus | No | Yes | Yes |
| Probabilities | S&P 500 and Nasdaq | Every stock and report | Every stock and report |
| API and MCP | 50 calls a day, 5 a minute | 5,000 calls a day, 50 a minute | 50,000 calls a day, 300 a minute |
| AI Fund | Yes (signed in) | Yes | Yes |
Monthly, no contract, cancel anytime and keep access to the end of the period. No trial; the Free plan is the trial. Plus at $299 a year is the lowest yearly price among the major flow tools we checked. Details: How much does Tradytics cost?
Who is Tradytics for?
Active traders who buy calls and puts or trade stocks and want to see where the money is going before they act: options flow, dealer positioning, dark pools and an AI analyst in one app, for less than a single flow tool costs at many competitors. For the case by plan, see Is Tradytics worth it?
Every Tradytics feature: clean options flow, ranked dark pool prints, Signals, the AI Fund, Probabilities, the backtester, Portfolio, custom dashboards and the API and MCP server.
Common questions
Is Tradytics free?
There is a Free plan that costs $0, needs no card and doesn't expire: the previous session's options flow and dark pool prints, charts, the scanner, gamma, stock research, 3 AI questions a day, Signals a day late, your portfolio and the AI Fund. See what the free plan includes.
Does Tradytics have a phone app?
Yes. Tradytics has a native iOS app on the App Store, plus the web app on desktop and phone.
How long has Tradytics been around?
Since July 2020. It has published market-wide net options flow since 2022 and per-stock net flow lines since 2021.
Does Tradytics have an API?
Yes, on every plan: a REST API with up to 300 calls a minute and 50,000 a day on Pro, covering every flow session since January 2022, plus an MCP server over every dataset. Docs are at /docs.
Can Tradytics place trades for me?
No. Broker linking is read only: Tradytics reads your holdings and trades to track your portfolio, and you place trades with your broker.